
Page 577 - Economia Azul - versão: inglês
P. 577
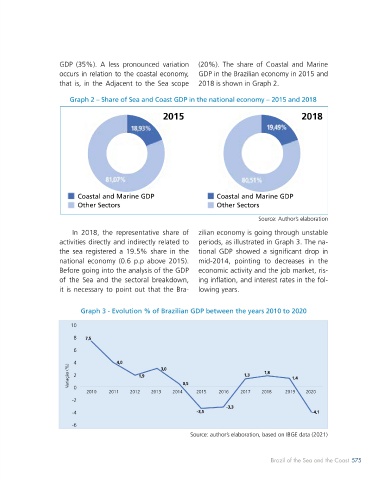
3. Brazil of the Sea and the Coast  GDP  (35%). A less pronounced variation   (20%).  The  share  of  Coastal  and  Marine
                   occurs in relation to the coastal economy,   GDP in the Brazilian economy in 2015 and
 The methodology used to obtain data   pared to 2.6 % in 2015); (ii) Adjacent to the   that  is,  in  the  Adjacent  to  the  Sea  scope   2018 is shown in Graph 2.
 on the sea and coastal economy for the   Sea, indirectly related to the economy of the
 year 2018  was the  Input-Output  Model.   sea, relevant to the coastal economy (around   Graph 2 – Share of Sea and Coast GDP in the national economy – 2015 and 2018
 In the present case, the second IOMSea is   16.5% of the national GDP in the years sur-  2015  2018
 presented, since the first accounted for the   veyed). It is worth mentioning that in Annex
 data for the year 2015.  A are the activities of the Marine Dimension
 scope (Table A.1), which are the most import-
 3.1 Brazilian Coastal and Marine   ant in this portion of the economy as they are
 Gross Domestic Product  highly dependent on natural resources.
 A growth in the indicator was identified   For a better view of the indicator’s evo-
 for the mentioned years, although modest:   lution, Table 4 breaks it down into sectors.

 Thus, it is observed that: (i) Marine Dimen-  Comparing the values   between 2015
 sion, directly related to the economy of the   and 2018, the Marine Dimension scope   Coastal and Marine GDP  Coastal and Marine GDP
 sea (3.0% of national GDP in 2018 com-  showed the highest percentage growth in   Other Sectors  Other Sectors
                                                                             Source: Author’s elaboration
 Table 4 – Brazilian Coastal and
 Marine GDP            In 2018, the representative share of   zilian economy is going through unstable
                   activities directly and indirectly related to   periods, as illustrated in Graph 3. The na-
 Setor  GDP  (billions BR)  2015-  the sea registered a 19.5% share in the   tional GDP showed a significant drop in
                  2015   % Mar   2018   national economy (0.6 p.p above 2015).   mid-2014, pointing to decreases in the
                        % Mar  2018
 Living Marine Resources   10,768   1.0   18,501   1.4   0.72  Before going into the analysis of the GDP   economic activity and the job market, ris-

 Marine Energy   16,790   1.5   49,437   3.6   1.94  of the Sea and the sectoral breakdown,   ing inflation, and interest rates in the fol-
                   it is necessary to point out that the Bra-  lowing years.
 Marine Manufactures   38,083   3.4   27,298   2.0   -0.28
 Marine Transport   9,192   0.8   7,3550   0.5   -0.20
                         Graph 3 - Evolution % of Brazilian GDP between the years 2010 to 2020
 Marine Services   60,305   5.4   82,840   6.1   0.37
                      10
                      10
 Marine Defense   22,342   2.0   26,950   1.9   0.21
                       8 8  7,5
                           7,5
                       Marine Dimension   157,480   14.1   212,381   15.6   0.35
                       6 6
 Primary Adjacent to the Sea   23,891   2.1   23,950   1.8   0.00
                                    4,0
                       4 4         4,0
 Secondary Adjacent to the Sea   173,472   15.5   191,213   14.0   0.10  2 2  3,0  1,8
                                                 3,0
                                                                                1,8
                                                                         1,3
                                          1,9
                                                                                        1,4
 Tertiary Adjacent to the Sea   762,717   68.2   937,505   68.7   0.23  Variação (%)  Variação (%)  1,9  0,5  1,3  1,4
                                                       0,5
                                                           2015
                                              2013
                                                     2014
                                                                  2016
                                                                                     2019
                                                                                            2020
                                                                        2017
                                                                               2018
                           2010
                                 2011
                     Adjacent to the Sea   960,080   85.9   1152,668   84.4   0.20  0 0  2010          2011          2012          2013   2014  2015          2016           2017          2018           2019            2020
                                        2012
                      -2
                      -2
 Total  1117,56  100  1365,049  100  0.22                           -3,3
                                                                    -3,3
                      -4
                                                           -3,5
                                                                                              -4,1
                      -4                                   -3,5                              -4,1
 Participation in the national economy   18.9                      19.4
                      -6
                      -6
 Source: author’s elaboration, with methodology proposed by Carvalho (2018)
                                                         Source: author’s elaboration, based on IBGE data (2021)
 574   BLUE ECONOMYBLUE ECONOMY                                                  Brazil of the Sea and the Coast 575
 574