
Page 575 - Economia Azul - versão: inglês
P. 575
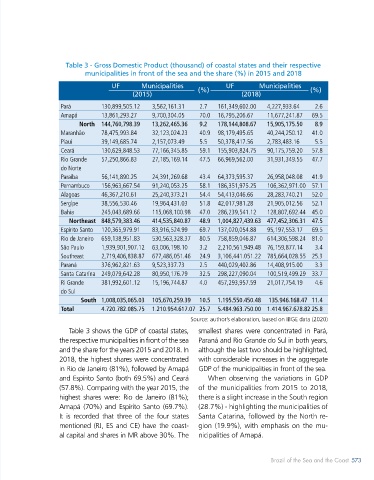
Table 3 - Gross Domestic Product (thousand) of coastal states and their respective
 Table 2 - Metropolitan regions and urban agglomerations   municipalities in front of the sea and the share (%) in 2015 and 2018
 in coastal states in 2020

                                  UF       Municipalities    (%)    UF        Municipalities    (%)
 State     Type/Total Number   Type/Number                   Participation    (2015)  (2018)
    of Municipalities   of municipalities        (%)
          in front of the sea  Pará  130,899,505.12  3,562,161.31  2.7  161,349,602.00  4,227,933.64  2.6
 São Paulo   6 RM (168)  RM Baixada Santista (9)  6.0  Amapá   13,861,293.27   9,700,304.05   70.0  16,795,206.67   11,677,241.87   69.5
 3 AGL (49)  RM Vale do Paraíba e               North  144,760,798.39  13,262,465.36  9.2  178,144,808.67  15,905,175.50  8.9
 Litoral Norte (4)  Maranhão   78,475,993.84   32,123,024.23   40.9  98,179,495.65   40,244,250.12   41.0
                                                                                              5.5
 Rio Grande do Sul  2 RM (48)  AGL Litoral Norte (10)  16.4  Piauí  39,149,685.74  2,157,073.49  5.5  50,378,417.56  2,783,483.16  57.8
                                                            59.1  155,903,824.75
                               130,629,848.53
                                              77,166,345.85
                   Ceará
                                                                                90,175,759.20
 2 AGL (25)  AGL Sul (2)  Rio Grande    57,250,866.83   27,185,169.14   47.5  66,969,562.00   31,931,349.55   47.7
 Alagoas  RM (83)  RM Caetés (1)  9.6  do Norte
 RM Maceió (5)     Paraíba     56,141,890.25   24,391,269.68   43.4  64,373,595.37    26,958,048.08   41.9
 RM São Francisco (2)  Pernambuco   156,963,667.54   91,240,053.25   58.1  186,351,975.25   106,362,971.00  57.1
 Amapá  1 RM (3)  RM Macapá (1)  33.0  Alagoas   46,367,210.61   25,240,373.21   54.4  54,413,046.66   28,283,740.21   52.0
 Bahia  1 RM (29)  RM Salvador (9)  31.0  Sergipe   38,556,530.46   19,964,431.03   51.8  42,017,981.28   21,905,012.56   52.1
 Ceará  RM (46)  RM Fortaleza (9)  19.6  Bahia   245,043,689.66   115,068,100.98   47.0  286,239,541.12   128,807,692.44  45.0
 Espirito Santo  RM (7)  RM Grande Vitória (4)  57.1       Northeast  848,579,383.46   414,535,840.87   48.9  1,004,827,439.63  477,452,306.31  47.5
 Maranhão  RM (35)  RM Grande São Luiz (6)  17.1  Espírito Santo   120,365,979.91   83,916,524.99   69.7  137,020,054.88   95,197,553.17   69.5
 Paraíba  RM (159)  RM João Pessoa (7)  6.3  Rio de Janeiro  659,138,951.83   530,563,328.37   80.5  758,859,046.87   614,306,598.24  81.0
 RM Vale do Mamanguape (3)  São Paulo   1,939,901,907.12  63,006,198.10   3.2   2,210,561,949.48  76,159,877.14   3.4
 Pernambuco  RM (14)  RM Recife (8)  57.1  Southeast   2,719,406,838.87  677,486,051.46   24.9  3,106,441.051.22  785,664,028.55  25.3
                               376,962,821.63
                                                                 440,029,402.86
                                                                                              3.3
                                                                                14,408,915.00
                   Paraná
                                                            2.5
                                              9,523,337.73
 Rio de Janeiro  1 RM (22)  RM Rio de Janeiro (9)  40.9  Santa Catarina  249,079,642.28   80,950,176.79   32.5  298,227,090.04   100,519,499.29  33.7
 Rio Grande do Norte  RM (15)  RM Natal (6)  40.0  Ri Grande    381,992,601.12   15,196,744.87   4.0   457,293,957.59   21,017,754.19   4.6
 Santa Catarina   RM (295)  RM Carbonífera (5)  5.8  do Sul
 RM Foz do Rio Itajaí (8)              South  1,008,035,065.03  105,670,259.39   10.5  1.195.550.450.48   135.946.168.47  11.4
 RM Florianópolis (6)  Total   4.720.782.085.75  1.210.954.617.07  25.7  5.484.963.750.00  1.414.967.678.82 25.8
 RM Tubarão (3)                                          Source: author’s elaboration, based on IBGE data (2020)
 RM Norte/Nordeste Catarinense (3)  Table 3 shows the GDP of coastal states,   smallest shares  were  concentrated in Pará,
 Total    998   120   12.0
                   the respective municipalities in front of the sea   Paraná and Rio Grande do Sul in both years,
                   and the share for the years 2015 and 2018. In   although the last two should be highlighted,
 Source: author’s elaboration, based on IBGE (2020)  2018, the highest shares were concentrated   with considerable increases in the aggregate
                   in Rio de Janeiro (81%), followed by Amapá   GDP of the municipalities in front of the sea.
                   and Espírito Santo (both 69.5%) and Ceará   When observing the variations in GDP
                   (57.8%). Comparing with the year 2015, the   of the municipalities from 2015 to 2018,
 Of the 280 municipalities in front of the   territories with multiple uses and conflicts   highest shares were: Rio de Janeiro (81%);   there is a slight increase in the South region
 sea, 120 (43%) are located in MR or AGL.   in which extremely fragile ecosystems are   Amapá (70%) and Espírito Santo (69.7%).   (28.7%) - highlighting the municipalities of
 Being part of a MR advocates the integra-  present, organizing effective public policies   It is recorded that three of the four states   Santa Catarina, followed by the North re-
 tion of public policies among the munic-  that meet the greatest number of interests   mentioned (RJ, ES and CE) have the coast-  gion (19.9%), with emphasis on the mu-
 ipalities that comprise them. Considering   is an additional challenge.  al capital and shares in MR above 30%. The   nicipalities of Amapá.


 572   BLUE ECONOMYBLUE ECONOMY                                                  Brazil of the Sea and the Coast 573
 572