Page 578 - Economia Azul - versão: inglês
P. 578

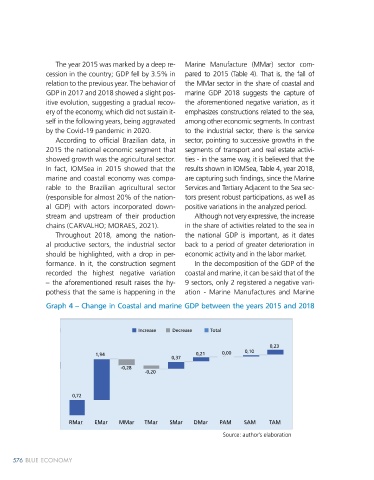
The year 2015 was marked by a deep re-  Marine Manufacture (MMar) sector com-                                   Transport - when comparing the perfor-   Thus, the tourist finds a developed urban
               cession in the country; GDP fell by 3.5% in   pared to 2015 (Table 4). That is, the fall of                       mance of that indicator between the years   infrastructure, especially a powerful tour-
               relation to the previous year. The behavior of   the MMar sector in the share of coastal and                      2015 and 2018 (Graph 4).                 ism and leisure sector with beautiful beach-
               GDP in 2017 and 2018 showed a slight pos-  marine GDP 2018 suggests the capture of                                   We can see that the sectorial pattern   es bathed by the Atlantic Ocean.
               itive evolution, suggesting a gradual recov-  the aforementioned negative variation, as it                        of 2015 is partially repeated in 2018. The   Still with regard to the sectors that had
               ery of the economy, which did not sustain it-  emphasizes constructions related to the sea,                       Marine Services sector continues with a   an intensified participation in the maritime
               self in the following years, being aggravated   among other economic segments. In contrast                        strong participation (6.1%) and vigorous   and  coastal  economy,  it  is  worth  mention-
               by the Covid-19 pandemic in 2020.        to the industrial sector, there is the service                           growth in the period (37% in the period   ing the Marine Energy sector (from 1.5% to
                 According to official Brazilian data, in   sector, pointing to successive growths in the                        2015-2018), as well as the concentration   3.6%) currently, primarily related to offshore
               2015 the national economic segment that   segments of transport and real estate activi-                           (68.7%) in tertiary activities developed  in   oil and gas exploration resources. Comparing
               showed growth was the agricultural sector.   ties - in the same way, it is believed that the                      the vicinity of the sea (growth of 23% in   national oil production between 2010 and

               In fact, IOMSea in 2015 showed that the   results shown in IOMSea, Table 4, year 2018,                            the same period). In other words, the econ-  2020, the values  grew by 43.5% – 1,076.0
               marine and coastal economy was compa-    are capturing such findings, since the Marine                            omy related – directly and indirectly – to   compared to  749,900  barrels (Graph 5).
               rable to the Brazilian agricultural sector   Services and Tertiary Adjacent to the Sea sec-                       the  sea  is  imbued  with  tourism  activities,   When looking at national production be-
               (responsible for almost 20% of the nation-  tors present robust participations, as well as                        other categories of transport, accommoda-  tween 2015 and 2018, there is a growth of
               al GDP) with actors incorporated down-   positive variations in the analyzed period.                              tion, and food, among others.            6.1% – 944.1% compared to 889.6 million
               stream and upstream of their production     Although not very expressive, the increase                               Carvalho (2018) points out that the   barrels.  It  is  interesting  to  disaggregate  ac-
               chains (CARVALHO; MORAES, 2021).         in the share of activities related to the sea in                         tourism sector is very developed in Brazil,   cording to the location of oil production in
                 Throughout 2018, among the nation-     the national GDP is important, as it dates                               most of its territory maintains temperatures   the period. Offshore production increased
               al productive sectors, the industrial sector   back to a period of greater deterioration in                       around 30 ºC throughout the year. Almost   by 8.7% to 903.3 million barrels from 831.2
               should be highlighted, with a drop in per-  economic activity and in the labor market.                            20% of the national population is located   million  barrels.  In  a  different  way,  onshore
               formance. In it, the construction segment   In the decomposition of the GDP of the                                on the seafront, and 120 (43%) municipal-  production registered a drop of 30.4% –
               recorded the highest negative variation   coastal and marine, it can be said that of the                          ities in front of the sea are located in met-  40.6% compared to 58.3 million barrels in
               – the aforementioned result raises the hy-  9 sectors, only 2 registered a negative vari-                         ropolitan regions or urban agglomerations.    the same period (ANP 2019; 2021).
               pothesis that the same is happening in the   ation - Marine Manufactures and Marine
                                                                                                                                              Graph 5 – Evolution of oil production between 2010 and
               Graph 4 – Change in Coastal and marine GDP between the years 2015 and 2018                                                                     2020 at sea and on land
                                                                                                                                     1.200.000
                                                                                                                                       1.200.000
                                          Increase  Decrease   Total
                                                                                                                                     1.000.000
                                                                                                                                       1.000.000
                                                                                 0,23
                                                                                                                                        800.000
                             1,94                           0,21    0,00   0,10                                                       800.000
                                                    0,37
                                                                                                                                        600.000
                                     -0,28                                                                                          mil (barris) Thousand (barrels)  600.000
                                            -0,20                                                                                     400.000
                                                                                                                                        400.000
                       0,72
                                                                                                                                      200.000
                                                                                                                                        200.000
                                                                                                                                       Terra
                                                                                                                                       Land
                                                                                                                                       Mar  0
                                                                                                                                       Sea
                                                                                                                                                                              2016
                                                                                                                                                                   2014
                                                                                                                                                                        2015
                                                                                                                                                                                   2017
                                                                                                                                                                                              2019
                                                                                                                                                                                                    2020
                                                                                                                                                                                         2018
                                                                                                                                                  2011
                                                                                                                                             2010
                                                                                                                                                        2012
                                                                                                                                                             2013
                     RMar    EMar   MMar    TMar   SMar   DMar    PAM    SAM     TAM                                                   BR   2010        2011       2012        2013       2014       2015       2016       2017       2018       2019       2020
                                                                                                                                       BR
                                                                                                                                                                  Source: author’s elaboration, based on ANP data (2019; 2021)
                                                                   Source: author’s elaboration
     576   BLUE ECONOMY                                                                                                                                                                         Brazil of the Sea and the Coast 577
                                                                                                                                                                                                Brazil of the Sea and the Coast
                                                                                                                                                                                                                       577
   573   574   575   576   577   578   579   580   581   582   583