Page 580 - Economia Azul - versão: inglês
P. 580

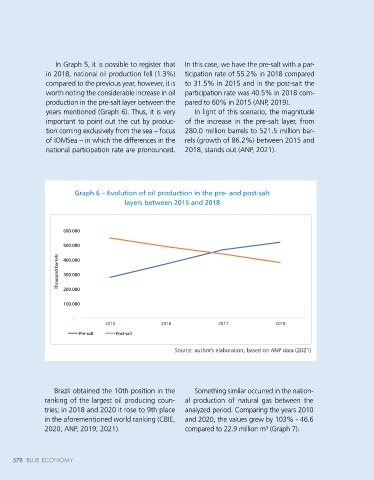
In Graph 5, it is possible to register that   In this case, we have the pre-salt with a par-                             Graph 7 – Evolution of natural gas production between 2010 and
               in 2018, national oil production fell (1.3%)   ticipation rate of 55.2% in 2018 compared                                                       2020 at sea and on land
               compared to the previous year, however, it is   to 31.5% in 2015 and in the post-salt the
               worth noting the considerable increase in oil   participation rate was 40.5% in 2018 com-
                                                                                                                                    50.000,0
               production in the pre-salt layer between the   pared to 60% in 2015 (ANP, 2019).                                      50.000,0
                                                                                                                                    40.000,0
               years mentioned (Graph 6). Thus, it is very   In light of this scenario, the magnitude                                45.000,0
                                                                                                                                     40.000,0
               important to point out the cut by produc-  of the increase in the pre-salt layer, from                                35.000,0
                                                                                                                                    30.000,0
               tion coming exclusively from the sea – focus   280.0 million barrels to 521.5 million bar-                            30.000,0
                                                                                                                                    25.000,0
               of IOMSea – in which the differences in the   rels (growth of 86.2%) between 2015 and                               Millions of m 3 milhões de m 3   25.000,0
                                                                                                                                    20.000,0
               national participation rate are pronounced.   2018, stands out (ANP, 2021).                                           20.000,0
                                                                                                                                    15.000,0
                                                                                                                                     15.000,0
                                                                                                                                    10.000,0
                                                                                                                                     10.000,0
                                                                                                                                     5.000,0
                                                                                                                                     5.000,0
                                                                                                                                        -
                                                                                                                                                               2013
                                                                                                                                                  2011
                                                                                                                                            2010
                                                                                                                                                         2012
                                                                                                                                                                     2014
                                                                                                                                                                                  2016
                                                                                                                                                                                        2017
                                                                                                                                                                                              2018
                                                                                                                                                                                                     2019
                                                                                                                                                                           2015
                                                                                                                                                                                                           2020
                       Graph 6 – Evolution of oil production in the pre- and post-salt                                                      2010         2011          2012           2013         2014         2015         2016          2017         2018         2019         2020
                                      layers between 2015 and 2018                                                                      Brasil    Terra      Mar
                                                                                                                                        Brazil
                                                                                                                                                             Sea
                                                                                                                                                  Land

                                                                                                                                                                      Source: Own elaboration based on ANP data (2019; 2021)
                    600.000
                    600.000
                                                                                                                                    Directing the analysis to the years 2015   Although Brazil is among the largest
                    500.000                                                                                                      and 2018, national production of natural   O&G producers in the world, the Brazilian
                    500.000
                                                                                                                                 gas grew by 16%. Disaggregating by loca-  Petroleum Institute (IBP - Instituto Brasile-
                  Thousand barrels  mil barris   300.000                                                                         tion, it is observed that the production from   iro do Petróleo, 2020) cites that the coun-
                    400.000
                    400.000

                                                                                                                                 the sea presents values  significantly above
                                                                                                                                                                          try should take advantage of all its energy
                    300.000
                                                                                                                                 the fields located on land. That is, at sea in
                    200.000
                    200.000
                                                                                                                                                                          ergy transition strategies. These are exist-
                                                                                                                                 2018 the national share was 80.4% com-   sources, exploring decarbonization and en-
                    100.000                                                                                                      pared to 76.1% in 2015; on land in 2018, a   ing challenges, as the world will continue
                    100.000
                                                                                                                                 participation of 19.6% was obtained, com-  to consume oil and gas, but with greater
                       -                                                                                                         pared to 23.9% in 2015 (ANP 2019; 2021).  concern to reduce and offset carbon emis-
                                2015             2016             2017            2018
                                2015                                     2016                                      2017                                      2018
                                                                                                                                    When comparing the results of offshore   sions (CARVALHO; MORAES, 2021)
                        Pré-sal    Post-salt
                                   Pós-sal
                        Pre-salt
                                                                                                                                 fields located offshore, the pattern found in   In addition to the aforementioned sec-
                                                     Source: author’s elaboration, based on ANP data (2021)                      oil production is repeated. That is, in the pre-  tor, the extraction of living resources reg-
                                                                                                                                 salt (30.2% in 2015 and 51.4% in 2018)   istered an increase in participation in the
                                                                                                                                 and in the post-salt (45.9% in 2015 and   economy directly and indirectly related to
                                                                                                                                 29.0% in 2018), allowing us to say that the   the sea (from 1.0% to 1.4%) in the same
                                                                                                                                 pre-salt assumes leadership in production   period. According to the world fisheries sta-
                 Brazil obtained the 10th position in the   Something similar occurred in the nation-
              ranking of the largest oil producing coun-  al production of natural gas between the                               compared to post-salt as of 2016 (Graph 8).  tistics published by FAO (2020), the impor-
              tries; in 2018 and 2020 it rose to 9th place   analyzed period. Comparing the years 2010                              It is recorded that in 2018 Brazil moved   tance of developing countries as consum-
              in the aforementioned world ranking (CBIE,   and 2020, the values   grew by 103% - 46.6                            to 31st position and in 2020 to 30th po-  ers of fish has constantly increased, reflect-
              2020; ANP, 2019; 2021).                   compared to 22.9 million m³ (Graph 7).                                   sition in the world ranking of natural gas   ing urbanization and the expansion of the
                                                                                                                                 producers (ANP, 2019; 2021).             middle class that consume fish. However,
     578   BLUE ECONOMYBLUE ECONOMY                                                                                                                                                             Brazil of the Sea and the Coast 579
     578
   575   576   577   578   579   580   581   582   583   584   585