
Page 584 - Economia Azul - versão: inglês
P. 584
The participation of occupations directly zilian economy in the years 2015 and 2018 Graph 10 - Productivity of the Sea Dimension scope, by sector, in the
and indirectly related to the sea in the Bra- are shown in Graph 9. years 2015 and 2018
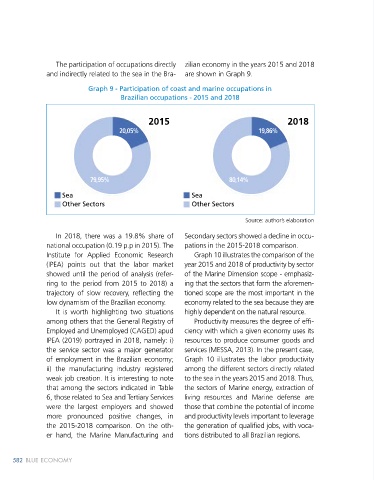
Graph 9 - Participation of coast and marine occupations in 1400,000
Brazilian occupations - 2015 and 2018
1200,000
2015 2018 1000,000
20,05% 19,86%
800,000
600,000
79,95% 80,14% 400,000
Sea Sea 200,000
Other Sectors Other Sectors
0,000
Source: author’s elaboration RMar EMar MMar TMar SMar DMar
2015 2018
In 2018, there was a 19.8% share of Secondary sectors showed a decline in occu-
national occupation (0.19 p.p in 2015). The pations in the 2015-2018 comparison. Source: Own elaboration
Institute for Applied Economic Research Graph 10 illustrates the comparison of the
(IPEA) points out that the labor market year 2015 and 2018 of productivity by sector 5. Conclusions
showed until the period of analysis (refer- of the Marine Dimension scope - emphasiz-
ring to the period from 2015 to 2018) a ing that the sectors that form the aforemen- Initiatives aimed at recognizing the con- people, generating more than BRL530
trajectory of slow recovery, reflecting the tioned scope are the most important in the tribution, scaling the participation of the billion in salaries. The final demand of
low dynamism of the Brazilian economy. economy related to the sea because they are sea to the national economy, are still recent the sectors was estimated at BRL1.5 trillion.
It is worth highlighting two situations highly dependent on the natural resource. in Brazil, despite having one of the largest Focusing on the Marine Dimension scope,
among others that the General Registry of Productivity measures the degree of effi- coastal extensions in the world. the most important of the economy related
Employed and Unemployed (CAGED) apud ciency with which a given economy uses its In this way, this chapter sheds light to the sea, two other sectors stood out in
IPEA (2019) portrayed in 2018, namely: i) resources to produce consumer goods and on the theme by answering the guiding 2018 with substantial increases in total par-
the service sector was a major generator services (MESSA, 2013). In the present case, questions related to the contribution of ticipation: Marine Energy and Living Marine
of employment in the Brazilian economy; Graph 10 illustrates the labor productivity the sea-related economy to Brazil and its Resources. Brazil is a world leader in the
ii) the manufacturing industry registered among the different sectors directly related predominant activities. The national coast- production of oil and gas, with emphasis
weak job creation. It is interesting to note to the sea in the years 2015 and 2018. Thus, al and marine economy reach, in 2018, on the pre-salt layer. As for Living Resourc-
that among the sectors indicated in Table the sectors of Marine energy, extraction of a 19.5% share of the national GDP (0.6 es, Brazil in 2018 was still experiencing the
6, those related to Sea and Tertiary Services living resources and Marine defense are p.p. above 2015), and its predominant highest fish production from capture. How-
were the largest employers and showed those that combine the potential of income activity is the Sea Services sector, with ever, from the year 2020 onwards, nation-
more pronounced positive changes, in and productivity levels important to leverage emphasis on the tourism. Furthermore, al production by capture and aquaculture
the 2015-2018 comparison. On the oth- the generation of qualified jobs, with voca- the classified sectors employed, between practically equaled and, in the year 2021, an
er hand, the Marine Manufacturing and tions distributed to all Brazilian regions. formal and informal, close to 21 million orientation towards aquaculture is observed.
Brazil of the Sea and the Coast 583
582 BLUE ECONOMY Brazil of the Sea and the Coast 583