
Page 582 - Economia Azul - versão: inglês
P. 582
evaluating the Brazilian participation with- ditions to become a major fish producer
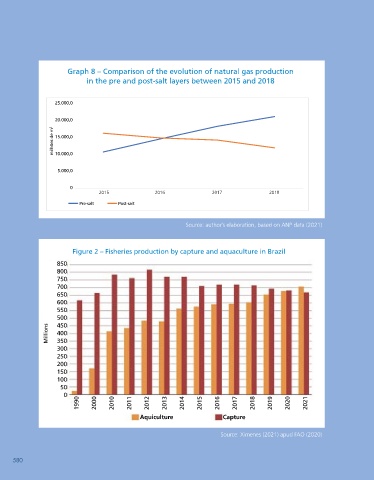
Graph 8 – Comparison of the evolution of natural gas production in this market is complex, especially due to and leverage the domestic market. In oth-
in the pre and post-salt layers between 2015 and 2018 the lack of official production data (capture er words, “it has high availability of labor,
and aquaculture) to FAO since 2014. environmental characteristics favorable to
25.000
25.000,0 Figure 2 shows that Brazilian produc- production in the open sea and strategic
tion by capture and aquaculture grew location for the flow of production to the
20.000
20.000,0 in the 2015/2018 comparison. Ximenes Southern Cone, Europe and the USA”
milhões de m 3 Millions of m3 15.000,0 (2021) points out that Brazil has the con- (XIMENES, 2021, p. 2).
milhões de m 3
15.000
4. Occupations of Brazilian Coastal and Marine
10.000
10.000,0
It is observed for the indicator compar- economy of the sea, that is, relevant to the
5.000
5.000,0 ing the years mentioned: (i) Marine Dimen- coastal economy (around 17.6% of nation-
sion, directly related to the economy of the al occupations in the years surveyed). High-
0 0
2015 2016 2017 2018 sea (2.2% of the national occupation in lighting that the values include formal and
2016
2015
2018
2017
2018 compared to 2.1% in 2015); (ii) Ad- informal workers, Table 5 breaks down the
Pré-sal Pós-sal
Pre-salt
Post-salt
jacent to the Sea, indirectly related to the aforementioned scopes into sectors
Table 5 – Formal and informal occupations related to the
Source: author’s elaboration, based on ANP data (2021)
Brazilian Coastal and marine
Sector Occupations (millions) 2015-
Figure 2 – Fisheries production by capture and aquaculture in Brazil 2015 % Sea 2018
% Sea 2018
850
800 Living Marine Resources 130.408 0,7 114.270 0,6 -0,12
750 Marine Energy 48.275 0,2 39.204 0,2 -0,19
700
650 Marine Manufactures 314.593 1,6 239.134 1,2 -0,24
600
550 Marine Transport 91.066 0,5 93.881 0,5 0,03
500 Marine Services 1.320.004 6,7 1.731.793 8,4 0,31
450
Millions 400 Marine Defense 179.814 0,9 163.695 0,8 -0,09
350
300 Marine Dimension 2.084.160 10,5 2.381.977 11,5 0,14
250 Primary Adjacent to the Sea 742.059 3,7 626.750 3,0 -0,16
200
150 Secondary Adjacent to the Sea 1.175.127 5,9 1.064.488 5,1 -0,09
100
50 Tertiary Adjacent to the Sea 15.828.093 79,8 16.645.875 80,0 0,05
0 Adjacent to the Sea 17.745.279 89,5 18.337.113 88,0 0,03
1990 2000 2010 2011 2012 2013 2014 2015 2016 2017 2018 2019 2020 2021
Aquiculture Capture Total 19.829.438 100,0 20.719.090 100,0 0,04
Participation in the national economy 20,05 19,86
Source: Ximenes (2021) apud FAO (2020) Source: author’s elaboration, with methodology proposed by Carvalho (2018)
580 BLUE ECONOMY Brazil of the Sea and the Coast 581
580