Page 572 - Economia Azul - versão: inglês
P. 572

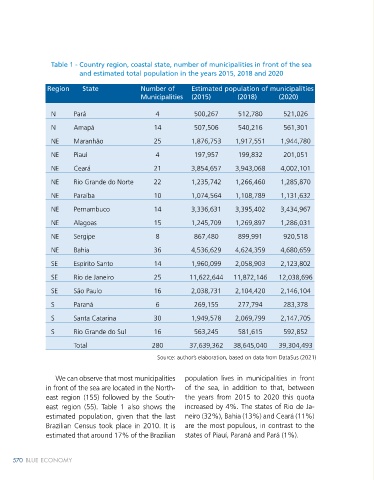
Table 1 - Country region, coastal state, number of municipalities in front of the sea                                    Graph 1 - Estimated total population of municipalities in front
                         and estimated total population in the years 2015, 2018 and 2020                                                      of the sea, by State, in the years 2015, 2018 and 2020

               Region    State             Number of      Estimated population of municipalities                                 Rio Grande do Sul
                                           Municipalities  (2015)      (2018)      (2020)
                                                                                                                                 Santa Catarina
                N      Pará                    4          500,267      512,780       521,026                                     Paraná

                N      Amapá                   14         507,506      540,216       561,301                                     São Paulo
                                                                                                                                 Rio de Janeiro
                NE     Maranhão                25         1,876,753    1,917,551    1,944,780
                                                                                                                                 Espírito Santo
                NE     Piauí                   4          197,957      199,832       201,051                                     Bahia
                NE     Ceará                   21         3,854,657    3,943,068    4,002,101                                    Sergipe
                                                                                                                                 Alagoas
                NE     Rio Grande do Norte     22         1,235,742    1,266,460    1,285,870
                                                                                                                                 Pernambuco
                NE     Paraíba                 10         1,074,564    1,108,789    1,131,632                                    Paraíba

                NE     Pernambuco              14         3,336,631    3,395,402    3,434,967                                    Rio Grande do Norte
                                                                                                                                 Ceará
                NE     Alagoas                 15         1,245,709    1,269,897    1,286,031
                                                                                                                                 Piauí
                NE     Sergipe                 8          867,480      899,991       920,518
                                                                                                                                 Maranhão
                NE     Bahia                   36         4,536,629    4,624,359    4,680,659                                    Amapá

                SE     Espírito Santo          14         1,960,099    2,058,903    2,123,802                                    Pará
                                                                                                                                  2020        0,000    2,000   4,000     6,000   8,000    10,000   12,000   14,000
                SE     Rio de Janeiro          25        11,622,644   11,872,146   12,038,696                                     2018
                                                                                                                                  2015                                 (millions)
                SE     São Paulo               16         2,038,731    2,104,420    2,146,104
                                                                                                                                                                                            Source: author’s elaboration
                S      Paraná                  6          269,155      277,794       283,378
                                                                                                                                    All municipalities showed a population   Another interesting point to be men-
                S      Santa Catarina          30         1,949,578    2,069,799    2,147,705
                                                                                                                                 increase, even if slight, with emphasis on   tioned is that 13 coastal states have mu-
                S      Rio Grande do Sul       16         563,245      581,615       592,852                                     the states of Amapá (11%), Santa Catarina   nicipalities in front of the sea located in
                                                                                                                                 (10%) and Espírito Santo (8%). Although   metropolitan regions (MR) or urban ag-
                       Total                  280        37,639,362   38,645,040   39,304,493
                                                                                                                                 it is not among the three states with the   glomerations (AGL). The IBGE (2020) rec-
                                                Source: author’s elaboration, based on data from DataSus (2021)                  highest population dynamics, Rio Grande   ommends that the main purpose of such
                                                                                                                                 do Sul, in a survey released by the Brazilian   spatial cuts is the identification of polit-
                 We can observe that most municipalities   population lives in municipalities in front                           Institute of Geography and Statistics, found   ical-administrative units in Brazil, which
               in front of the sea are located in the North-  of the sea, in addition to that, between                           that among the ten municipalities that had   qualify for specific treatment due to their
               east region (155) followed by the South-  the years from 2015 to 2020 this quota                                  a population increase between 2017 and   planning and management particularities.
               east region (55). Table 1 also shows the   increased by 4%. The states of Rio de Ja-                              2018, seven are located on the north coast   Thus, Table 2 explains the MR and AGL in
               estimated  population, given that the last   neiro (32%), Bahia (13%) and Ceará (11%)                             of the State, as opposed to more than two   which the municipalities of the economy
               Brazilian Census took place in 2010. It is   are the most populous, in contrast to the                            thirds of the municipalities that registered   related to the sea are in comparison to the
               estimated that around 17% of the Brazilian    states of Piauí, Paraná and Pará (1%).                              population reduction.                    respective State.


                                                                                                                                                                                                Brazil of the Sea and the Coast 571
     570   BLUE ECONOMY                                                                                                                                                                         Brazil of the Sea and the Coast 571
   567   568   569   570   571   572   573   574   575   576   577