Page 639 - Economia Azul - versão: inglês
P. 639

b
                                                            b
 A 3-D controlled source electromagnetic  in the area also indicate fluid flow related   Figure Z5
 (CSEM) survey of the areas where the pock-  chimneys not yet connected to the surface
 marks are concentrated allowed the distinc-  (Figure Z4). The inversion of the CSEM data
 tion between a chimney that possibly has  also reveals that the gas below the BSR mi-
 trapped fluid and a chimney that seems to  grates along the faults through the GHSZ
 have allowed all the gas to leak towards  forming bodies rich in gas hydrate with
 the seabed (THARIMELA et al, 2019). The  gas hydrate saturation of 40-60% (THARI-
 method is based on the resistivity difference  MELLA et al., 2019). It also shows that the
 between  the  highly  resistive  free  gas  and  anomalous amplitudes below the BSR in
 the sediment bearing salt water and/or hy-  the seismic data may represent free gas ac-
 drate with lower resistivity. Other locations  cumulations (Figure Z5).


                    A                                                                            A'
                   o  A                                                                          A'
                   o
 Figure Z4: (A) Backscatter image of the   Bottom: high-resolution seismic profile,
 seabed highlighting the expression of   correlated. The largest resistivity anoma-
                 -1000
 surface faults and the area covered by the   lies within the gas hydrate stability zone   -1000
 controlled source electromagnetic survey   are possibly associated with gas hydrate
 (3-D CSEM yellow polygon). The yellow   saturations. Note that it also revealed gas   -2000   ----------  --------------
                                         ----
                                                         -----
 arrow highlights the occurrence of pock-  chimneys not yet connected to the sur-  -2000   ----------  ----  -----  --------------  2.20  ::É
                                                                                              2.20  ::É
                                                                                              2.37  1:
                                                                                              2.54  .C  1:
                                                                                              2.54
 mark 22 - Figure Z2). (B) Top: CSEM pro-  face, as well as the CSEM expression in the   --- --------- ----- - - ----  ---  2.37   0  0
                                                                                              2.70  .C
                                        Zone of highest concentration of free gas
                                                                                              '·"'
                                        Zone of highest concentration of free gas
                                                                                              2.67
                                                                                              2.70
                                                                                              3.21  '·"'
                                                                                              2.67
 file illustrating the anomalies identified   subsurface of the pockmark area.   -3000   --- --------- ----- - - ----  ---  3.38  -
                                                                                              3.21
                                                                                              3.38
                                                                                              3.55  -
                 -3000
                                                                                              3.55
                                                                                              3.72
                                                                                              3.72
 in the inversion (warm colors).   Source: Authors elaboration, 2022                          4.00
                                                                                              4.00
                 -4000
                 -4000
 Figure Z4
                 -2000
                 -2000
                                        Zone of highest concentration of free gas
                 -3000
                 -3000
                                                                                     ,  ,
                 �MO                                                                 '
                 �MO                                                                 '
                                                  �
                                                  -
                                                                                               -
                                                      ----- -----
                                                                          ""=
                                                                                            -
                                                                                              �-
                                                                         -
                                                                                               �
                                                               -
                                                                --------- ---·
                                                -
                                      ··--
                                     ,
                                           --'---
                                ---
                                   -
                                  -
                                     --
                                               �
                                    �
                           ---�-- ·----·                                      -   - � -  - - - �  -- - ------�-
                               -
                                   -
                                 '"
                                                                                            -
                                   -
                                   -
                                                                                              �-
                                                                                               �
                                                                                               -
                           ---�-- ·----·                                      -   - � -  - - �  -- - ------�-
                                  -
                                ---
                               -
                                      ··--
                                                      ----- -----
                                                               -
                                     --
                                           --'---
                                               �
                                                -
                                                  �
                                                  -
                                                                         -
                                     ,
                                                                          ""=
                                                                                     -
                                    �
                                                                --------- ---·
                                 '"
                                                                        Source: Authors elaboration, 2022
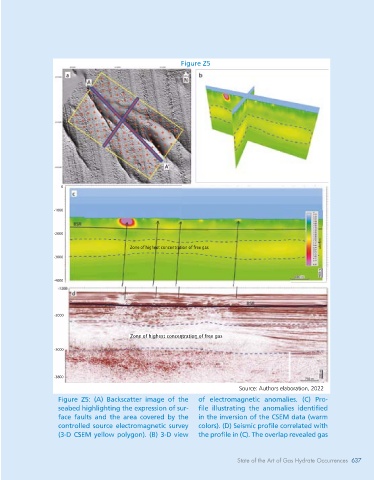
                  Figure Z5: (A) Backscatter image of the   of electromagnetic anomalies. (C) Pro-
                  seabed highlighting the expression of sur-  file illustrating the anomalies identified
                  face faults and the area covered by the   in the inversion of the CSEM data (warm
 Source: Authors elaboration, 2022  controlled source electromagnetic survey   colors). (D) Seismic profile correlated with
                  (3-D CSEM yellow polygon). (B) 3-D view   the profile in (C). The overlap revealed gas
                                                                       State of the Art of Gas Hydrate Occurrences 637
 636   BLUE ECONOMY                                                    State of the Art of Gas Hydrate Occurrences   637
   634   635   636   637   638   639   640   641   642   643   644