
Page 635 - Economia Azul - versão: inglês
P. 635
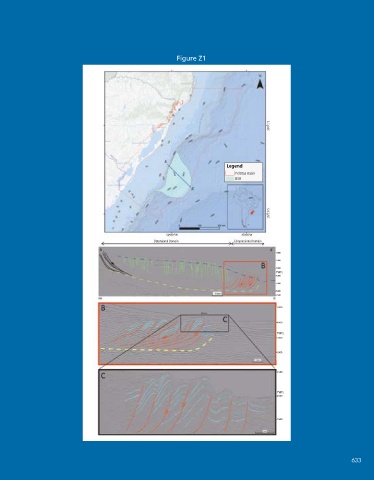
Figure Z1
 The Rio Grande Cone Gas Hydrates Province


 The Rio Grande Cone (RGC) is located   that accommodate the movement in a set
 in the southern portion of the Pelotas Basin   of horsts and grabens. In the compressional

 and has an approximate area of  35,000 km²,   domain (red rectangle in Figure Z1) there are
 at water depths between 200 and 3,000 m,   thrust faults with thrusting and folding of
 200 km from the city of Rio Grande. The   the sedimentary layers, folds with a high an-
 maximum thickness of sediments reaches   gle of closure that form gaps of the order of   30 o 0’0’’S
 about 5,000 m (FONTANA, 1996), deposited   200 m in the seabed (SILVEIRA and MACH-
 since the lower Miocene, about 23 M.a. The   ADO, 2004; CASTILLO et al., 2009).
 RGC is mainly composed of fine siliciclastic   Unlike the Foz do Amazonas Fan region,
 sediments, whose construction is attributed   the BSR reflector presents itself continuously   Legend
                                                                       Pelotas Basin
 to inputs from three different drainages, the   in the seismic lines, from 520 m to approxi-  BSR
 La  Plata  (MARTINS  et  al., 1972;  CONTRE-  mately 3,500 m in water depth, extrapolat-
 RAS et al., 2010), Camaquã and Jacuí rivers   ing the eastern limit of the Cone. Its area

 (BUENO, 2021), although today there is no   of   occurrence reaches 35,000 km² (Figure
 large-scale drainage flowing there.  Z1), with an average thickness of around   35 o 0’0’’S
 As in the Foz do Amazonas Fan, the RGC   200-300 m (SAD et al., 1998; OLIVEIRA et
 is in the process of gravitational collapse,   al., 2010). Sad et al. (1998), assuming these   50 o 0’0’’’W  45 o 0’0’W
 where the upper portion slides over the de-  volumetric parameters and estimating a   Distensional Domain  Compressional Domain
 tachment surface at the base of the Miocene   1.5% saturation of gas hydrates, conclude   1.000
 sequence. The structures formed in the RGC   that there is a possible volume of 780 tcf   2.000
                                                                                   3.000
 region have their genesis related to the rapid   (~22 trillion m³) of methane in the region. It   TWTs
                                                                                   4.000
 accumulation of sediments coming from the   should be noted that these numbers were   5.000
 west-southwest, from the Miocene, associat-  based on volumes extrapolated from the   6.000
                                                                                   6.500
 ed with mega mass wasting events (MTDs) to   seismic data.
                                                                                   3.000
 the east-northeast, forming a zone of over-  Figure  Z1:  Bathymetric  map  highligh-
 pressure, substrate for tectonic movement   ting the BSR occurrence area in the Rio   4.000
 (detachment zone). This detachment surface   Grande Cone, in blue. (A) – Seismic line   TWTs
 caused all the layers above it to move, form-  A-A’ showing the detachment surface, in   5.000
 ing two tectonic domains with distinct struc-  yellow, and the extensional and compres-  6.000
 tural characteristics, the extensional domain,   sional domains; in the extensional domain,
 and the compressional domain (MILLER et al.,   listric normal faults (black) and flat,  syn-  3.500
 2015 – Figure Z1).  thetic, and antithetic normal faults (green)
 In the extensional domain, near the   are recognized. The compressional domain
                                                                                   TWTs
 western limit of the RGC, normal and listric   is characterized by thrust faults (red). The   4.000
 blue dashed line corresponds to the BSR.
 faults favored the migration of gas at the de-  (B) – Red rectangle corresponding to the
 pocenter position, and the increase in sedi-  detail of the folds. C – Note the thrusting   4.500
 ment pressure caused the formation of mud   of the NW-SE layers.
 diapirs, residual anticlines and fault swarms   Source: Miller et al., (2015)


                                                                                                         633
 632   BLUE ECONOMY                                                    State of the Art of Gas Hydrate Occurrences 633