
Page 685 - Economia Azul - versão: inglês
P. 685
there is a constant stability, that is, there 1.57 – 2019 – 11th position), in which we – 45 MTEU (million TEUS) in 2020; Singapo- value. This has a direct relationship with
was no growth in this international share notice a sharp decay. On the other hand, re (37 MTEU); Ningbo-Zhoushan (32 MTEU); the industry. The main containerized lo-
when compared between the beginning we check the case of Japan (2.80 – 2000 – Shezhen (26 MTEU); Rotterdam (15 MTEU). ads in maritime transport are presented by
and end of the series, mainly in products 1st position – 2.49 – 2019 – 1st position), It is clearly observed that the 4 main ports Port Economics, Management and Policy
with higher added value, which demand a South Korea (1.25 – 2000 – 20th position presented in the world are directly related to (2021), as follows:
specific infrastructure for cargo handling, – 2.05 – 2019 – 4th position), as well as their level of complexity, and the first nine . Miscellaneous manufactures include
such as container terminals. China (0.44 – 2000 – 39th position – 1.35 in the world are concentrated in Asia, and items made of plastic (e.g., bags), toys,
In this way, we can identify the degree – 2019 – 16th position), Singapore (1.55 – as demonstrated in the previous section, sporting goods, or office supplies;
of economic complexity from the loads we 2000 – 11th position – 2.00 – 2019 – 5th the region that expanded its ICE. Rotterdam . Electrical machines, including electri-
export and move in the country. Thus, eco- position) and Vietnam (0.59 – 2000 – 93rd is the only European port in force among cally powered machines such as electrical
nomic development requires the accumula- position – 0.05 – 2019 – 56th position), the first in the world, in the tenth position. cables, appliances, batteries and integra-
tion of productive knowledge and its use in showing that some countries have increa- When we analyze the case of Brazil, we see ted circuits;
increasingly complex sectors. The Harvard sed their production complexity in the last that in the same period the terminals that . Vegetables and fruits make up an im-
Growth Lab country rankings assess a coun- few years. This shows that port logistics had the greatest growth in exports were portant segment of transport by refrige-
try’s current state of productive knowledge development has a strong correlation with those connected to ores and vegetable solid rated containers. This sector has seen re-
using the Economic Complexity Index (ECI). the degree of global economic complexity. bulk. The port of Santos, which is the largest markable growth with more reliable cold
Countries improve their ECI by increasing public port in Brazil, is in the 45th position chain logistics;
the number and complexity of products they 1.6 Economic complexity reflects on in terms of global movements totaling 2.6 . Textiles and made-up items include
successfully export, that is, higher techno- container transport million units (4.23 million TEU), according to yarn, woven fibers, blankets, sheets, cur-
logy products represent a higher degree of the Port of Santos 2020 yearbook. tains and rugs.
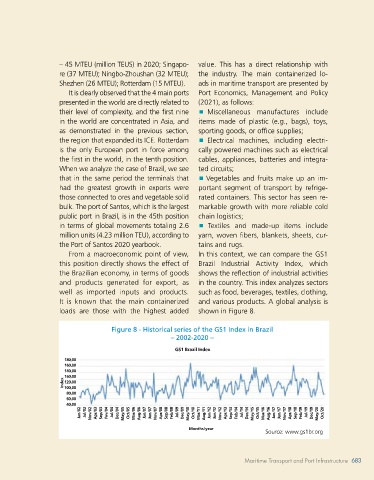
ECI, which represents greater added value. The movement of containers can be From a macroeconomic point of view, In this context, we can compare the GS1
In 2000, the Brazilian ICE was 0.86 used as a thermometer to evaluate the eco- this position directly shows the effect of Brazil Industrial Activity Index, which
(26th position) and in 2019 it was 0.10 nomy of a country, considering the nature the Brazilian economy, in terms of goods shows the reflection of industrial activities
(53rd position). In other words, these data, of the main loads that are usually on bo- and products generated for export, as in the country. This index analyzes sectors
when compared with Figure 7, show that ard these boxes. The recent example of this well as imported inputs and products. such as food, beverages, textiles, clothing,
due to the greater participation in the glo- phenomenon occurred with Covid-19. For It is known that the main containerized and various products. A global analysis is
bal market share of products such as com- a few months the global economy went loads are those with the highest added shown in Figure 8.
modities (agricultural and mineral), the into a process of stagnation, but when it
country has been reducing its complexity in resumed, all the reflection was based on Figure 8 - Historical series of the GS1 Index in Brazil
terms of production for export. This means the shortage of containers, queues of ships – 2002-2020 –
that cargo that is shipped in large volumes in ports and congestion. This was a positi- GS1 Brazil Index
at Brazilian ports has less production com- ve sign of economic recovery in the world’s 180,00
plexity compared to cargo from other cou- largest economies. To validate our state- 160,00
140,00
ntries with a higher degree of industrializa- ment, it is enough to carry out a compari- 160,00
tion and technological value added to the son of the main global container terminals Index 120,00
100,00
exported products. This phenomenon is not in recent years, and the container is a cargo 80,00
60,00
only Brazilian, but it also occurs with other that generally transports products with hi- 40,00
countries such as Argentina (0.14 – 2000 gher added value, which consequently has Jan/02 Jul/02 Nov/02 Apr/03 Sep/03 Fev/04 Jul/04 Dec/04 May/05 Oct/05 Mar/06 Aug/06 Jan/07 Jun/07 Nov/07 Apr/08 Sep/08 Feb/08 Jul/09 Dec/09 May/10 Oct/10 Mar/11 Aug/11 Jan/12 Jun/12 Nov/12 Apr/13 Sep/13 Feb/14 Jul/14 Dec/14 May/15 Oct/15 Mar/16 Aug/16 Jan/17 Jun/17 Nov/17 Apr/18 Sep/18 Feb/19 Jul/19 Dec/19 M
– 54th position – 0.24 – 2019 – 73rd), the a correlation with the ICE of the countries. Months/year
United States (1.99 – 2000 – 6th position – The main container handling port is Shanghai Source: www.gs1br.org
683
Maritime Transport and Port Infrastructure
682 BLUE ECONOMY Maritime Transport and Port Infrastructure 683