
Page 680 - Economia Azul - versão: inglês
P. 680
the gradual opening of some markets, shi- in 2021. Basically, the Brazilian port infras- Figure 4 - Evolution of EBTIDA of shipping companies
pping companies adjusted their supply and tructure is divided between public (organi- in the container sector in 2021
demand strategy, in terms of the availabili- zed port) and private (leases and outside 50,0%
ty of ships to meet the market. At the end the organized port). Private port terminals 44,4%
of 2020, a partial recovery of the economy handle approximately 66.2% of all cargo 38,2%
was observed, with an increase in demand volume, showing the large participation of 40,0%
and production in Asia and an increase in the private sector in the port process, either
consumption in the Northern Hemisphere. through leases operating within the public 30,0%
The higher occupancy of ships generated a port, or through private terminals outside EBIT Margin 24,5%
significant increase in earnings for shipping the organized port area. 20,0%
companies and less idle slots. On the other This national port infrastructure is in line 14,8%
hand, even with the increase in waiting ti- with the country’s vocation, especially with 10,0% 8,5%
mes at ports, what happens is an increase regard to its main commodities-focused ex- 3,0% 5,3% 1,9% 3,7% 2,6%
in the demand for transport, which cau- port cargo. The analysis of data from the 500,0% -1,3% -1,1% 1,0% 1,1% 1,4% 1,7% 2,4%
ses freight prices to rise, bringing greater yearbook of the National Water Transport -5,6% 3,1% -3,8%
financial return to shipowners, since the Agency (ANTAQ) shows that the five main -9,3%
operational cost does not increase in the cargoes are: (i) iron ore (370 million tons – -10,0%
same proportion. In addition, the effect of Mt – 31%); (ii) Oil and derivatives (crude Q1 2016 Q2 2016 Q3 2016 Q4 2016 Q1 2017 Q2 2017 Q3 2017 Q4 2017 Q1 2018 Q2 2018 Q3 2018 Q4 2018 Q1 2019 Q2 2019 Q3 2019 Q4 2019 Q1 2020 Q2 2020 Q3 2020 Q4 2020 Q1 2021 Q2 2021
economies of scale by transporting cargo oil) – (195 Mt – 16%); (iii) containers (133 Period
on larger ships helps to reduce unit costs, Mt – 11%); (iv) soybean (109 Mt – 9%); (v) Source: statista.com
which maximizes revenue, whose margins oil and derivatives (without crude oil) (84
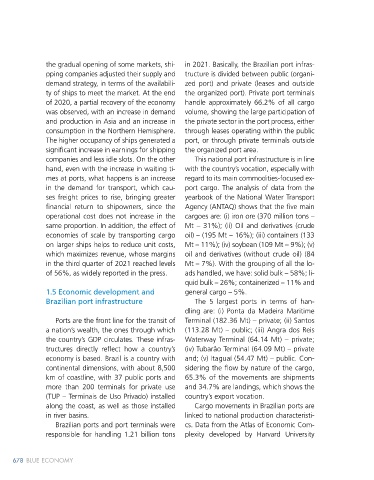
in the third quarter of 2021 reached levels Mt – 7%). With the grouping of all the lo- Figure 5 - Evolution of the main products exported by Brazil
between 1995-2019
of 56%, as widely reported in the press. ads handled, we have: solid bulk – 58%; li-
quid bulk – 26%; containerized – 11% and What did Brazil export between 1995 and 2019?
$3008
1.5 Economic development and general cargo – 5%. $2808
$2608
Brazilian port infrastructure The 5 largest ports in terms of han- $2408 Services
dling are: (i) Ponta da Madeira Maritime $2208
Ports are the front line for the transit of Terminal (182.36 Mt) – private; (ii) Santos $2008
$1808
a nation’s wealth, the ones through which (113.28 Mt) – public; (iii) Angra dos Reis $1608
the country’s GDP circulates. These infras- Waterway Terminal (64.14 Mt) – private; CURRENT GROSS EXPORT $1408 Minerals
$1208
tructures directly reflect how a country’s (iv) Tubarão Terminal (64.09 Mt) – private $1008
economy is based. Brazil is a country with and; (v) Itaguaí (54.47 Mt) – public. Con- $808
$608
continental dimensions, with about 8,500 sidering the flow by nature of the cargo, $408 Agriculture
km of coastline, with 37 public ports and 65.3% of the movements are shipments $208
$0
more than 200 terminals for private use and 34.7% are landings, which shows the 1996 1998 2000 2002 2004 2006 2008 2010 2012 2004 2016 2018
(TUP – Terminais de Uso Privado) installed country’s export vocation.
PRODUCT
along the coast, as well as those installed Cargo movements in Brazilian ports are SECTORS VISUALIZATION
SEARCH IN
1995 2019
in river basins. linked to national production characteristi-
Brazilian ports and port terminals were cs. Data from the Atlas of Economic Com- 1996 1998 2000 2002 2004 2006 2008 2010 2012 2014 2016 2018
Source: Harvard Atlas of Economic Complexity (2021)
responsible for handling 1.21 billion tons plexity developed by Harvard University Figura 5 - Evolução dos principais produtos exportados pelo Brasil entre 1995-2019
Fonte: Atlas da complexidade econômica de Harvard (2021)
678 BLUE ECONOMY Maritime Transport and Port Infrastructure 679679
Maritime Transport and Port Infrastructure
Av. Paulista, 1079, 8 .andar, CEP 01311-200 – S. Paulo – SP – Brasil - WhatsApp: +55-11-994-482-884
o
End. operacional: Rua Sampaio Viana 167 - 31 - CEP 04004-000 – São Paulo – SP - Fone +55-11-3057-0646
www.essentialidea.com.br - [email protected]