
Page 677 - Economia Azul - versão: inglês
P. 677
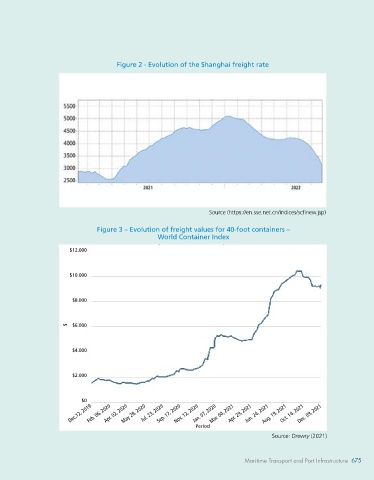
values in the last 20 years up to 2019   more than a week to dock. The chain ef-  Figure 2 - Evolution of the Shanghai freight rate
 shows  a  behavior with some fluctuation,   fect was basically on charter prices and,
 mainly in the periods between 2004 and   consequently, on the value of freight paid
 2008,  which  accompanied  the  develop-  to transport a container from Asia to Brazil.
 ment boom in China and a sharp drop in   The evolution of freight values can be seen
 subsequent periods, keeping values within   in  Figure  2,  which  shows  the  Shanghai
 levels practiced by the international mari-  Containerized Freight Index (SCFI).
 time transport market.  The SCFI was officially launched on
 It so happens that, with the arrival of   October 16, 2009. This index reflects
 Covid-19, the dynamics of the market has   ocean freight and associated maritime
 changed significantly. First there were the   surcharges for individual shipping lanes
 closings of international borders, starting   in the spot market.
 with China in early 2020. This had an im-  Shipping routes are  the main export
 pact on international trade, as this country   container trade routes from Shanghai to
 is the world’s largest manufacturer of high   the following regions: Europe, Mediterra-
 value-added products that it distributes to   nean Sea, US West Coast, US East Coast,
 the rest of the world. Naturally, the closing   Persian Gulf, Australia/New Zealand, West   Source (https://en.sse.net.cn/indices/scfinew.jsp)
 of the Chinese borders caused the cargo to   Africa, South Africa, South America, West   Figure 3 – Evolution of freight values for 40-foot containers –
 be held up in its ports. The ships then be-  Japan, East Japan, Southeast Asia and   World Container Index
 gan to wait to dock, causing an imbalance   South Korea. The units used by the indi-
 in the supply and demand for the transport   cator refer to USD/TEU (USD/FEU is for US   $12.000
 and distribution service of products within   West Coast and East Coast services).
 the global supply chain. With the spread   In  terms  of  dollar  amounts,  Figure  3   $10.000
 of the virus across the globe, other borders   presents the World Container Index de-
 also closed, as was the case with many   veloped by Drewry, showing  the evolu-
 countries in Europe and the United States   tion of ocean freight rates and associated   $8.000
 (LAZARIN; VIEIRA, 2021).  maritime surcharges of individual shipping
 The cascade effect made the ships   lanes in the spot market.
                     $  $6.000
 stop at the ends, next to the ports wait-  In absolute terms, at the beginning of
 ing for the opportunity to load or unload.   2020, a container on the Shanghai-San-
 The consequence of this was the rup-  tos route cost around US$ 2,000. In early   $4.000
 ture in the global supply chain, in which   2021, the cost of shipping has increased to
 products began to be stocked at the end   $9,000. In June 2021, the value reached
 points, generating a reduction in the   levels of US$ 10,000 (Figure 3), and some   $2.000
 number of ships available in the system   shippers reported values in the order of
 to carry out the transport, with a lack of   US$ 15,000 in December 2021.
                         $0
 empty containers to be repositioned at   The dynamics of freight practiced for
 the origins, mainly in Asia.  maritime transport then began to have   Dec.12, 2019 Feb. 06, 2020 Apr. 02, 2020 May 28, 2020 Jul. 23, 2020 Sep. 17, 2020 Nov. 12, 2020 Jan. 07, 2020 Mar. 04, 2021 Apr. 29, 2021 Jun. 24, 2021 Aug. 19, 2021 Oct. 14, 2021 Dec. 09, 2021
 In the United States, container ships, es-  a new behavior after the emergence of   Period
 pecially on the west coast, have been waiting   Covid-19. Naturally, the higher values   Source: Drewry (2021)


                                                                         Maritime Transport and Port Infrastructure
 674   BLUE ECONOMY                                                      Maritime Transport and Port Infrastructure  675675