
Page 682 - Economia Azul - versão: inglês
P. 682
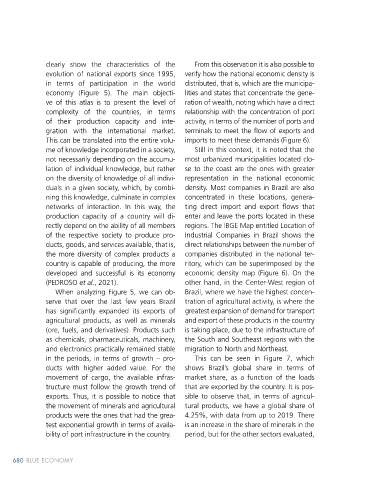
clearly show the characteristics of the From this observation it is also possible to Figure 6 - Map of the distribution of GDP x Economic Density
evolution of national exports since 1995, verify how the national economic density is Reference: 2019
in terms of participation in the world distributed, that is, which are the municipa-
economy (Figure 5). The main objecti- lities and states that concentrate the gene- GROSS DOMESTIC PRODUCT (GDP) PER CAPITA OF THE
THE
A OF
GROSS DOMESTIC PRODUCT (GDP) PER CAPIT
TES (2019)
BRAZILIAN ST
A
ve of this atlas is to present the level of ration of wealth, noting which have a direct BRAZILIAN STATES (2019) Data source: IBGE (2019)
complexity of the countries, in terms relationship with the concentration of port Coordinate System: Planes
Projection: UTM/SIRGAS 2000
of their production capacity and inte- activity, in terms of the number of ports and
BRL - Amounts in thousand reais
Amounts in thousand reais
-
gration with the international market. terminals to meet the flow of exports and BRL 14.292 (Ror aima/RR)
14.292 (Roraima/RR)
15.630 (Acre/AC
This can be translated into the entire volu- imports to meet these demands (Figure 6). 15.630 (Acre/A C
17.497 (Amapá/AP)
17.497 (Amapá/AP)
me of knowledge incorporated in a society, Still in this context, it is noted that the 39.356 (Tocantins/TO)
ocantins/T
39.356 (T
O)
44.689 (Sergipe/SE)
44.689 (Sergipe/SE)
not necessarily depending on the accumu- most urbanized municipalities located clo- 47.091 (Rondônia/RO)
47.091 (Rondônia/RO)
52.781 (Piauí/PI)
lation of individual knowledge, but rather se to the coast are the ones with greater 52.781 (Piauí/PI)
58.964 (Alagoas/AL)
58.964 (Alagoas/AL)
67.986 (Paraíba/PB)
on the diversity of knowledge of all indivi- representation in the national economic 67.986 (P ar aíba/PB)
71.337 (Rio Gr
71.337 (Rio Grande do Norte/RN)
ande do Norte/RN)
duals in a given society, which, by combi- density. Most companies in Brazil are also 97.340 (Mar anhão/MA)
97.340 (Maranhão/MA)
106.943 (Mato Grosso do Sul/MS)
106.943 (Mato Grosso do Sul/MS)
ning this knowledge, culminate in complex concentrated in these locations, genera- BRL-Amounts in thousand reais 273.614 (Distrito Federal/DF)
L-Amounts in thousand reais
BR
eder
273.614 (Distrito F
al/DF)
networks of interaction. In this way, the ting direct import and export flows that 108.181 (Amazonas/AM) 293.241 (Bahia/BA)
293.241 (Bahia/BA)
108.181 (Amazonas/AM)
323.264 (Santa Catarina/SC)
137.346 (Espírito Santo/ES)
production capacity of a country will di- enter and leave the ports located in these Demographic density 137.346 (Espírito Santo/ES) 323.264 (Santa Catarina/SC)
ar
aná/PR)
466.377 (P
466.377 (Paraná/PR)
142.122 (Mato Grosso/MT)
142.122 (Mato Grosso/MT)
ande do Sul/RS)
482.464 (Rio Gr
163.575 (Cear
á/CE)
rectly depend on the ability of all members regions. The IBGE Map entitled Location of 163.575 (Ceará/CE) 482.464 (Rio Grande do Sul/RS)
651.873 (Minas Gerais/MG)
178.377 (P
ais/MG)
A)
á/P
ar
651.873 (Minas Ger
178.377 (Pará/PA)
aneiro/RJ)
779.928 (Rio de J
197.853 (P
ernambuco/PE)
of the respective society to produce pro- Industrial Companies in Brazil shows the 197.853 (Pernambuco/PE) 779.928 (Rio de Janeiro/RJ)
2.348.338 (São Paulo/SP)
aulo/SP)
2.348.338 (São P
208.672 (Goiás/GO)
208.672 (Goiás/GO)
ducts, goods, and services available, that is, direct relationships between the number of Source: IBGE (2019)
the more diversity of complex products a companies distributed in the national ter-
country is capable of producing, the more ritory, which can be superimposed by the Figure 7 - Participation of Brazil in the global market share
developed and successful is its economy economic density map (Figure 6). On the of cargo exports that pass through the ports
(PEDROSO et al., 2021). other hand, in the Center-West region of What share of the global market does Brazil export?
When analyzing Figure 5, we can ob- Brazil, where we have the highest concen-
serve that over the last few years Brazil tration of agricultural activity, is where the 4.5% Textiles X
Agriculture X
has significantly expanded its exports of greatest expansion of demand for transport 4% Stone X
agricultural products, as well as minerals and export of these products in the country Minerals X
3.5% Metals X
(ore, fuels, and derivatives). Products such is taking place, due to the infrastructure of
Chemicals X
as chemicals, pharmaceuticals, machinery, the South and Southeast regions with the 3% Vehicles X
and electronics practically remained stable migration to North and Northeast. 2.5% Machinery X
in the periods, in terms of growth – pro- This can be seen in Figure 7, which Share of Market Sector Electronics X
ducts with higher added value. For the shows Brazil’s global share in terms of 2% Services X
movement of cargo, the available infras- market share, as a function of the loads 1.5%
tructure must follow the growth trend of that are exported by the country. It is pos-
1%
exports. Thus, it is possible to notice that sible to observe that, in terms of agricul-
the movement of minerals and agricultural tural products, we have a global share of 0.5%
products were the ones that had the grea- 4.25%, with data from up to 2019. There
0% 1996 1998 2000 2002 2004 2006 2008 2010 2012 2014 2016 2018
test exponential growth in terms of availa- is an increase in the share of minerals in the
bility of port infrastructure in the country. period, but for the other sectors evaluated, Source: Harvard Atlas of Economic Complexity (2021)
680 BLUE ECONOMY Maritime Transport and Port Infrastructure 681681
Maritime Transport and Port Infrastructure