
Page 687 - Economia Azul - versão: inglês
P. 687
It is observed that in Brazil there is an os- This can also be verified when we compare Understanding the dynamics of the in- reduced emissions in the transport chain,
cillation between the years with high and low the quarterly evolution indices of the three ternational and national economy is very greater use of cabotage by companies also
in the indicator. When a sectored analysis is sectors that make up the national GDP, as important to interpret the growth prospects provide potential for capturing cargo for
carried out, it appears that there are sectors shown in Figure 9, which shows the variation or movement of container movements. The modal migration. But following the natural
with greater strength in relation to others. in the period between 2017 and 2021. projections for the year 2022 by the Bra- trend, which should be the result of an in-
zilian Central Bank are that the industrial crease in production and domestic demand
Figure 9 - Rate of change of the quarterly volume index of GDP considering
the main national sectors in the period from 2017 to 2021 sector should have a retraction of -1.3% and greater movement of containers, how-
in GDP. As for the agricultural sector, there ever this does not suggest that, according
Agriculture - total Industrial - total Services - total is an expectation of growth of 5.0% and to the analysis of available public economic
1.3% for services. The projection is that data, when compared to other countries.
1st quarter 2017 Brazilian GDP will grow by only 1% this Low growth in the industry affects the
3rd quarter 2021 25 2nd quarter 2017 year, while global GDP will be 4.1% accord- segment of transport of containers; this can
20
2nd quarter 2021 3rd quarter 2017 ing to data from the World Bank – Global be observed from the perspective of the
15
10 Economic Prospects (2022). global participation in the Brazilian exports
1st quarter 2021 4th quarter 2017
5 The country’s low growth, especially in in the market share, when considering prod-
0 the industrial sector, may have an impact on ucts with higher added value that demand
4th quarter 2020 -5 1st quarter 2018
-10 this sector, even with the growth prospects mainly from containerized cargo, as shown
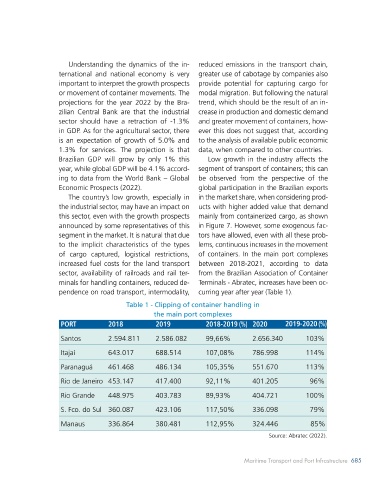
-15 announced by some representatives of this in Figure 7. However, some exogenous fac-
3rd quarter 2020 2nd quarter 2018 segment in the market. It is natural that due tors have allowed, even with all these prob-
to the implicit characteristics of the types lems, continuous increases in the movement
2nd quarter 2020 3rd quarter 2018 of cargo captured, logistical restrictions, of containers. In the main port complexes
increased fuel costs for the land transport between 2018-2021, according to data
1st quarter 2020 4th quarter 2018 sector, availability of railroads and rail ter- from the Brazilian Association of Container
4th quarter 2019 1st quarter 2019 minals for handling containers, reduced de- Terminals - Abratec, increases have been oc-
3rd quarter 2019 2nd quarter 2019 pendence on road transport, intermodality, curring year after year (Table 1).
Figura 9 - Taxa de variação do índice de volume trimestral do PIB considerando os Table 1 - Clipping of container handling in
Source: Sidra/IBGE (2022)
principais setores nacional no período de 2017 a 2021 the main port complexes
Fonte: Sidra/IBGE (2022)
It is clearly noted that over these four We cannot forget that the service sector PORT 2018 2019 2018-2019 (%) 2020 2019-2020 (%)
years there is a significant variation between is a major consumer of various products that
sectors, and the industrial sector represented are shipped and transported in containers, Santos 2.594.811 2.586.082 99,66% 2.656.340 103%
lower GDP growth in the analyzed period. for example, parts for replacement and repair Itajaí 643.017 688.514 107,08% 786.998 114%
The agricultural sector showed greater sta- of industrial equipment, electronics, house-
bility in terms of growth, with only three low hold appliances, etc. According to IBGE data, Paranaguá 461.468 486.134 105,35% 551.670 113%
periods, the most significant being the third in 2015 about 2 million companies had this Rio de Janeiro 453.147 417.400 92,11% 401.205 96%
Av. Paulista, 1079, 8 .andar, CEP 01311-200 – S. Paulo – SP – Brasil - WhatsApp: +55-11-994-482-884
o
End. operacional: Rua Sampaio Viana 167 - 31 - CEP 04004-000 – São Paulo – SP - Fone +55-11-3057-0646
half of 2021, with a reduction of 9%. How- classification. This sector was responsible for
www.essentialidea.com.br - [email protected]
ever, on average, the sector had a growth the occupation of 11 million people in this Rio Grande 448.975 403.783 89,93% 404.721 100%
of 3.8%. Although the industrial sector is period (IBGE, 2022). In this context of GDP, S. Fco. do Sul 360.087 423.106 117,50% 336.098 79%
responsible for the movement of high val- this sector showed greater stability over
ue-added cargo, in the evaluated period it is time, in relation to industry. In the evaluated Manaus 336.864 380.481 112,95% 324.446 85%
observed that the GDP growth was 0.29%. period, the growth was 0.8%. Source: Abratec (2022).
684 BLUE ECONOMY Maritime Transport and Port Infrastructure 685