
Page 688 - Economia Azul - versão: inglês
P. 688
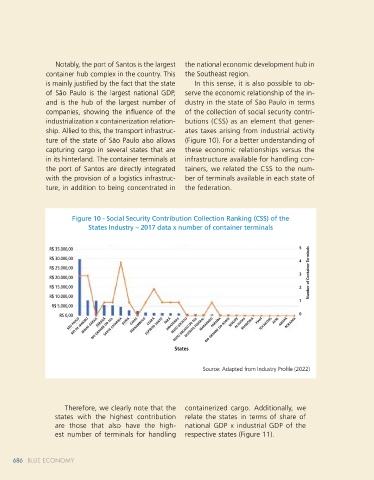
Notably, the port of Santos is the largest the national economic development hub in Figure 11 - Industry share in the state’s GDP. Reference: 2020
container hub complex in the country. This the Southeast region.
is mainly justified by the fact that the state In this sense, it is also possible to ob-
of São Paulo is the largest national GDP, serve the economic relationship of the in-
and is the hub of the largest number of dustry in the state of São Paulo in terms 35% 35%
29%
companies, showing the influence of the of the collection of social security contri- 30% 30%
industrialization x containerization relation- butions (CSS) as an element that gener- 25% 25%
ship. Allied to this, the transport infrastruc- ates taxes arising from industrial activity 20% 20%
ture of the state of São Paulo also allows (Figure 10). For a better understanding of GDP - State 15% 12% 11% 15% Industrial GDP
capturing cargo in several states that are these economic relationships versus the 10% 7% 8% 10%
in its hinterland. The container terminals at infrastructure available for handling con- 5% 5% 4% 3% 4% 2% 2% 5%
1% 2% 2% 2% 1% 1% 1% 1% 0% 1% 1% 0% 0% 0% 0%
the port of Santos are directly integrated tainers, we related the CSS to the num- 0% BAHIA GOIÁS PARÁ CEARÁ PIAUÍ ACRE
SANTA CATARINA
RIO GRANDE DO SUL
RIO DE JANEIRO
RIO GRANDE DO NORTE
AMAZONAS
ESPÍRITO SANTO
with the provision of a logistics infrastruc- ber of terminals available in each state of SÃO PAULO MINAS GERAIS PARANÁ DISTRITO FEDERAL PERNAMBUCO MATO GROSSO MATO GROSSO DO SUL MARANHÃO PARAÍBA ALAGOAS RONDÔNIA SERGIPE TOCANTINS AMAPÁ RORAIMA 0%
ture, in addition to being concentrated in the federation.
States
Figure 10 - Social Security Contribution Collection Ranking (CSS) of the Source: Adapted from Industry Profile (2022)
States Industry – 2017 data x number of container terminals
The integrated analysis of these data al- service, using more than one modal inte-
lows us to identify that although we see gration, in which cabotage plays a key role,
R$ 35.000,00 5 a year-to-year growth in the movement reducing the cost of the logistics chain.
R$ 30.000,00
4 of containers in some Brazilian ports, this In general, this shows the importance
R$ 25.000,00
3 Number of Container Terminals factor is not explained by the development of planning, as well as systemic analysis
R$ 20.000,00 of industrial activity (average growth 2017- for the development and growth of con-
R$ 15.000,00 2 2021 = 0.29%), but due to the opportunity tainer operations in Brazil, considering
R$ 10.000,00
1 of modal migration. Cargoes that are mi- the integration between consumer and
R$ 5.000,00
grating from road transport to cabotage producer poles, in addition to a logistics
R$ 0,00 0
RIO GRANDE DO SUL
GOIÁS
SÃO PAULO MINAS GERAIS PARANÁ SANTA CATARINA BAHIA PERNAMBUCO ESPÍRITO SANTO PARÁ AMAZONAS MATO GROSSO DO SUL MARANHÃO PARAÍBA SERGIPE ALAGOAS RONDÔNIA PIAUÍ TOCANTINS ACRE AMAPÁ RORAIMA have increased the movement of cargo in infrastructure that allows land access to
RIO DE JANEIRO
CEARÁ
MATO GROSSO
RIO GRANDE DO NORTE
DISTRITO FEDERAL
ports and multimodal integration. It is un-
ports. Since 2018, we have noticed a fast-
tors we will have room for new container
States er growth in cabotage movement, with likely that without these integrated fac-
the truck drivers’ strike as a major moti-
vating factor, which had an impact on the complexes in the country since the analy-
Source: Adapted from Industry Profile (2022) national logistics chain. This year, there sis of available infrastructure x economic
was a 12% growth in movement com- and industrial activity are intertwined. In
pared to 2017. Between 2020 and 2021, other words, it is no use just having access
the growth was 14%, with data from infrastructure, deep waters, without the
Therefore, we clearly note that the containerized cargo. Additionally, we ABAC - Consortium Administrators Brazil- demand for cargo to attract shipowners.
states with the highest contribution relate the states in terms of share of ian Association (2022). Linked to this, it is These aspects were previously discussed
are those that also have the high- national GDP x industrial GDP of the also verified that logistics companies have by Pereira (2021), showing the drivers for
est number of terminals for handling respective states (Figure 11). significantly expanded the door-to-door port development.
686 BLUE ECONOMYBLUE ECONOMY Maritime Transport and Port Infrastructure 687
686