
Page 673 - Economia Azul - versão: inglês
P. 673
of the naval industry allowed ship size to of the United Nations Conference on Trade in the routes where they could operate. An FPSO. In 2010, it was sent for recycling in Al-
increase, and new, more efficient alterna- and Development (UNCTAD) show the in- example of this was the ship Knock Nevis, ang, India, ending the cycle of the largest oil
tives were found to conduct transportation ternational participation of regions in the with 458 m in length, 67 m of beam and 24 tanker in the world (MARINE INSIGHT, 2021).
during each period of human progress. maritime market. In terms of shipments, the m of draft and 564,763 DWT, initially operat- Also in this context, from the 2000s
From sailing to the steam engine to in- distribution is as follows: Africa 7%; Ameri- ing between the Middle East and the United onwards, the maritime sector began to
ternal combustion engines, countless trans- cas 22%; Asia 41%; Europe 16%; Oceania States. In 1986 during the Iraq war it suffered again experience a significant increase in
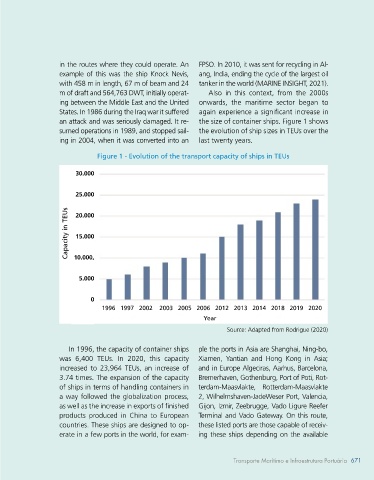
formations have occurred in the design of 14%. This means that these are the flows an attack and was seriously damaged. It re- the size of container ships. Figure 1 shows
vessels and in the materials used in their from these regions with cargo shipments for sumed operations in 1989, and stopped sail- the evolution of ship sizes in TEUs over the
construction. In 2021, there were around export. In unloading (import) we have: Afri- ing in 2004, when it was converted into an last twenty years.
99,800 merchant ships registered in the ca 5%; Americas 13%; Asia 62%; Europe
world. These ships are divided into the fol- 19%; Oceania 1%. This balance of supply Figure 1 - Evolution of the transport capacity of ships in TEUs
lowing proportions: 11% oil tankers; 12% and demand for international maritime 30.000
bulk carriers; 19% general post; 5% con- transport refers to the period of 2019, in
tainer; 51% other miscellaneous types, ac- which 11.76 billion tons were exported and
cording to the total classification based on 11.083 billion tons were imported. 25.000
UNCTADSTAT (2021) data. Annually, around It is clear that the flow of exports from
800 ships are sent for demolition a year, in countries, for example, the Americans, in- 20.000
pre- Covid-19 conditions. Until 2020, there cluding Brazil, is greater than imports, as
were about 2,779 orders for the construc- Brazil is a country that exports commodities Capacity in TEUs 15.000
tion of new ships in countries that are not in large quantities. On the other hand, it is
members of the OECD (WP6), with China observed that Asia, and more specifically Chi- 10.000,
as the main protagonist, with about 70.7% na, is a major importer. Therefore, there is an
of the orders for new construction, in which inversion in relation to the flow of cargo, that 5.000
most of the new construction contracts are is, many imported cargoes are processed in
for bulk carriers (DANIEL et al., 2021). Asian territory, to be later consumed internal-
The density of maritime transport is con- ly and then shipped for export. This dynamics 0
centrated in the Northern Hemisphere due of maritime transport in terms of supply and 1996 1997 2002 2003 2005 2006 2012 2013 2014 2018 2019 2020
to the economic issues of these nations, demand is what governs its activity. Year
that is, the wealth of the world in terms Source: Adapted from Rodrigue (2020)
of the value of transported goods. There is 1.2 Economy of scale
intense maritime transport on the Asia-Eu- In 1996, the capacity of container ships ple the ports in Asia are Shanghai, Ning-bo,
rope axis (Eurasia), which shows the impor- The maritime transport sector is going was 6,400 TEUs. In 2020, this capacity Xiamen, Yantian and Hong Kong in Asia;
tance of this flow for the global economic through a crucial moment to reduce the increased to 23,964 TEUs, an increase of and in Europe Algeciras, Aarhus, Barcelona,
matrix. On the Pacific Ocean side, there is unit costs of the ton transported onboard 3.74 times. The expansion of the capacity Bremerhaven, Gothenburg, Port of Poti, Rot-
also an Asia-North America (west coast) ships. When we compare the evolution of of ships in terms of handling containers in terdam-Maasvlakte, Rotterdam-Maasvlakte
flow, as well as Europe-North America on ship sizes, it is noted that in 1980 there was a way followed the globalization process, 2, Wilhelmshaven-JadeWeser Port, Valencia,
its east coast, concentrating the transport a movement towards the construction of as well as the increase in exports of finished Gijon, Izmir, Zeebrugge, Vado Ligure Reefer
flow of high value-added cargo. large oil tankers for cargo handling. How- products produced in China to European Terminal and Vado Gateway. On this route,
Sirimanne et al. (2021), published in the ever, the growth of these ships brought a countries. These ships are designed to op- these listed ports are those capable of receiv-
Review of Maritime Transportation (2021) problem to the ports since they were limited erate in a few ports in the world, for exam- ing these ships depending on the available
Maritime Transport and Port Infrastructure 671
670 BLUE ECONOMY Transporte Marítimo e Infraestrutura Portuária 671