
Page 449 - Economia Azul - versão: inglês
P. 449
compromised coastal ecosystems and the than 3,000 tons of oil residues collected
economy of the affected regions. along approximately 2,900 km of coastline
The ability to monitor and forecast the (SOARES et al., 2022), smaller oil spills oc-
movement of vessels and oil slicks at sea has cur with great frequency. During the peri-
a direct impact on the ability to deter oil spills od from December 31, 2021, to February
at sea by ships and oil exploration platforms 10, 2022, IBAMA identified the occurrence
in the Amazônia Azul (Blue Amazon). To of three contributions of oleaginous resi-
strengthen this capacity, the National Fund dues on the beaches of Paraíba and Ceará
for Scientific and Technological Development and an orphan oil slick at sea, which did
(FNDCT) approved funding in 2022 for the not reach the Coast. In order to exemplify
establishment of a System for the Detection, the future operation of SisMOM, the case of
Forecast and Monitoring of Oil Spills at Sea the appearance of oil slicks on the coast of
(SisMOM). The system will have the partici- Paraíba between 12/31/2021 and 1/1/2022
pation of INPE, IBAMA, UFBA, UFPR, UFSB, was analyzed. For this exercise, an experi-
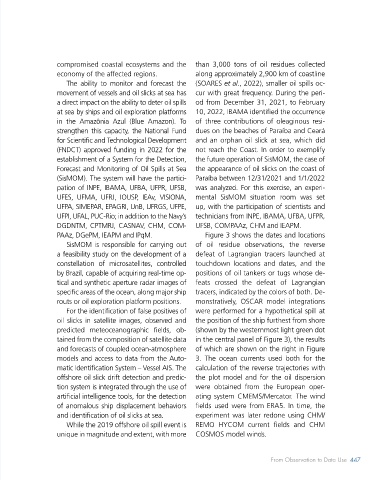
Figure 2. On the left, current map (in Brazilian coast affected by the oil spill UFES, UFMA, UFRJ, IOUSP, IEAv, VISIONA, mental SisMOM situation room was set
knots) of the HYCOM model provided marked in red and the distribution of UFPA, SIMEPAR, EPAGRI, UnB, UFRGS, UFPE, up, with the participation of scientists and
by the Navy Hydrography Center ocean currents in this region: Central UFPI, UFAL, PUC-Rio; in addition to the Navy’s technicians from INPE, IBAMA, UFBA, UFPR,
(CHM). The red square indicates the branch of the South Equatorial
area where the oil leak could occur. Current (CCSE), North Brazil Current DGDNTM, CPTMRJ, CASNAV, CHM, COM- UFSB, COMPAAz, CHM and IEAPM.
On the right, areas of the northeast (CNB) and Brazil Current (CB). PAAz, DGePM, IEAPM and IPqM. Figure 3 shows the dates and locations
SisMOM is responsible for carrying out of oil residue observations, the reverse
Source: Courtesy Brazilian Navy Hydrography Center, 2019
a feasibility study on the development of a defeat of Lagrangian tracers launched at
constellation of microsatellites, controlled touchdown locations and dates, and the
by Brazil, capable of acquiring real-time op- positions of oil tankers or tugs whose de-
coordinated by the Brazilian Navy, ANP and continental shelf in a North Brazil Current tical and synthetic aperture radar images of feats crossed the defeat of Lagrangian
IBAMA, with the participation of dozens of (NBC) and finally in a southwesterly direc- specific areas of the ocean, along major ship tracers, indicated by the colors of both. De-
researchers and institutions, investigations tion through the Brazil Current (BC) and routs or oil exploration platform positions. monstratively, OSCAR model integrations
were carried out to determine the region of inland shelf currents, reaching the Brazil- For the identification of false positives of were performed for a hypothetical spill at
origin and the cause of this serious environ- ian coast in different areas along the entire oil slicks in satellite images, observed and the position of the ship furthest from shore
mental accident. It was possible to identify coastline, as illustrated in Figure 2. predicted meteoceanographic fields, ob- (shown by the westernmost light green dot
that the spill occurred between July 24th The crossing of maritime traffic data tained from the composition of satellite data in the central panel of Figure 3), the results
and 29th, 2019, in an area of about 750 and intelligence allowed the identification and forecasts of coupled ocean-atmosphere of which are shown on the right in Figure
km from the coast of Paraíba (PB) and 390 of 3 tankers that traveled in the region models and access to data from the Auto- 3. The ocean currents used both for the
km from the external limits of the Brazil- determined by the meteoceanograph- matic Identification System – Vessel AIS. The calculation of the reverse trajectories with
ian Exclusive Economic Zone, that is, in the ic modeling conducted at CHM, during offshore oil slick drift detection and predic- the plot model and for the oil dispersion
high seas (FERREIRA, 2022). Approximately the aforementioned period, which could tion system is integrated through the use of were obtained from the European oper-
3,000 tons of oil were released on the high potentially have caused the oil spill (FER- artificial intelligence tools, for the detection ating system CMEMS/Mercator. The wind
seas, transported westward by the Central REIRA, 2022). Once again, operational of anomalous ship displacement behaviors fields used were from ERA5. In time, the
branch of the South Equatorial Current oceanography has demonstrated its rele- and identification of oil slicks at sea. experiment was later redone using CHM/
(CSEC) and subsequently distributed at the vant contribution, now in actions to mit- While the 2019 offshore oil spill event is REMO HYCOM current fields and CHM
current bifurcation point near the Brazilian igate the environmental damage that so unique in magnitude and extent, with more COSMOS model winds.
446 BLUE ECONOMIY From Observation to Data Use 447
446 BLUE ECONOMY