
Page 411 - Economia Azul - versão: inglês
P. 411
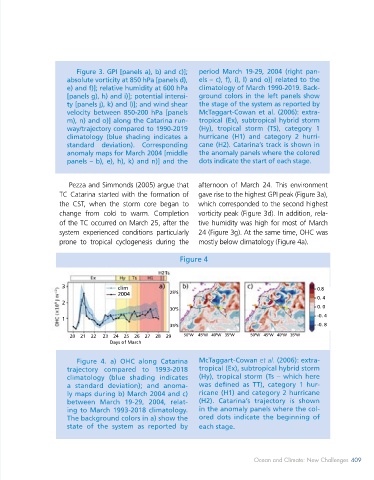
Figure 3
                        Figure 3. GPI [panels a), b) and c)];   period  March  19-29,  2004  (right  pan-
                     absolute vorticity at 850 hPa [panels d),   els – c), f), i), l) and o)] related to the
 H2Ts
 Ex  Hy  Hy  H1      e) and f)]; relative humidity at 600 hPa   climatology of March 1990-2019. Back-
 clim  a)  b)  c)  30  [panels g), h) and i)]; potential intensi-  ground colors in the left panels show
 wind shear (m s -1 )            pot. int. (m s -1 )              rel. humidity (%)        vorticity ( x10 -5   s -1 )                    GPI
 20  2004  25 S  20  ty [panels j), k) and l)]; and wind shear   the stage of the system as reported by
 0
 10                  velocity between  850-200 hPa [panels   McTaggart-Cowan et al. (2006): extra-
 10  30 S  0         m), n) and o)] along the Catarina run-  tropical (Ex), subtropical hybrid storm
 0
 -10                 way/trajectory compared to 1990-2019   (Hy),  tropical  storm  (TS),  category  1
 0  35 S  20         climatology (blue shading indicates a   hurricane (H1) and category 2 hurri-
 0
 -30                 standard deviation). Corresponding     cane (H2). Catarina’s track is shown in
 e)  f)  3           anomaly maps for March 2004 [middle    the anomaly panels where the colored
 0  25 S  2          panels – b), e), h), k) and n)] and the   dots indicate the start of each stage.
 0
 1
 0
 30 S
 0
 -5  10              Pezza and Simmonds (2005) argue that   afternoon of March 24. This environment
 20                TC Catarina started with the formation of   gave rise to the highest GPI peak (Figure 3a),
 35 S
 0
 -10  30           the CST, when the storm core began to    which corresponded to the second highest
 f)  30            change from cold to warm. Completion     vorticity peak (Figure 3d). In addition, rela-
 60  25 S  20      of the TC occurred on March 25, after the   tive humidity was high for most of March
 0
 10                system experienced conditions particularly   24 (Figure 3g). At the same time, OHC was
 40  0
 0
 30 S              prone to tropical cyclogenesis during the   mostly below climatology (Figure 4a).
 -10
 20  20
 35 S                                                  Figure 4
 0
 -30
 k)  l)  8                                      H2Ts
 0
 60  25 S  4       3                clim                                                       0.8
                                                     0
 0                                  2004           25 S
 0
 40  30 S          2                                                                           0. 4
 -4                                                                                            0. 0
                                                     0
                                                   30 S
 0
 20  35 S  -8      1                                                                           -0. 4
                                                   35 S                                        -0. 8
                                                     0
 40  h)   o)  12      20    21    22     23    24    25    26    27    28    29  50 0 W    45 0 W   40 0 W   35 0 W              50 0 W   45 0 W   40 0 W   35 0 W
 25 S  6                         Days of March
 0
 30
 0
 30 S
 0
 20  -6                 Figure 4. a) OHC along Catarina     McTaggart-Cowan et al. (2006): extra-
                     trajectory  compared  to  1993-2018    tropical (Ex), subtropical hybrid storm
 10  35 S  -12       climatology (blue shading indicates    (Hy), tropical storm (Ts – which here
 0
 20    21    22   23   24    25    26   27    28    29  50 0 W    45 0 W    40 0 W    35 0 W               50 0 W    45 0 W    40 0 W    35 0 W  a standard deviation); and anoma-  was defined as TT), category 1 hur-
 Days of March       ly maps during b) March 2004 and c)    ricane (H1) and category 2 hurricane
                     between March 19-29, 2004, relat-      (H2). Catarina’s trajectory is shown
                     ing to March 1993-2018 climatology.    in the anomaly panels where the col-
 Source Figures 3 e 4: Lauton, G et al. (2021)., Marta-Almeida, M., Dorfschäfer, G. S., & Lentini, C. A.   The background colors in a) show the   ored dots indicate the beginning of
 D. (2021). Metocean modulators of the first recorded South Atlantic Hurricane: Catarina. Geophysical   state of the system as reported by   each stage.
 Research Letters, 48, e2020GL091416. https://doi.org/10.1029/2020GL091416
 408  BLUE ECONOMY                                                          Ocean and Climate: New Challenges  409
 408   BLUE ECONOMY