
Page 407 - Economia Azul - versão: inglês
P. 407
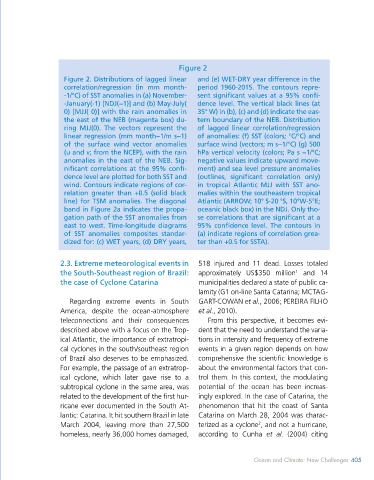
Figure 2
                                                      Figure 2
                    Figure 2. Distributions of lagged linear   and (e) WET-DRY year difference in the
                    correlation/regression (in mm month-   period 1960-2015. The contours repre-
 a        ENEB MJJ(0)  & (SST & WIND) ND (-1)J(0)  b        ENEB MJJ(0)  & (SST & WIND) MJJ (0)  -1/°C) of SST anomalies in (a) November-  sent significant values at a 95% confi-
                    -January(-1) [NDJ(−1)] and (b) May-July(   dence level. The vertical black lines (at
                    0) [MJJ( 0)] with the rain anomalies in   35° W) in (b), (c) and (d) indicate the eas-
                    the east of the NEB (magenta box) du-  tern boundary of the NEB. Distribution
                    ring MJJ(0).  The vectors represent the   of lagged linear correlation/regression
                    linear regression (mm month−1/m s−1)   of anomalies: (f) SST (colors; °C/°C) and
                    of the surface wind vector anomalies   surface wind (vectors; m s−1/°C) (g) 500
                    (u and v; from the NCEP), with the rain   hPa vertical velocity (colors; Pa s −1/°C;
                    anomalies in the east of the NEB. Sig-  negative values indicate upward move-
                    nificant correlations at the 95% confi-  ment) and sea level pressure anomalies
                    dence level are plotted for both SST and   (outlines, significant correlation only)
                    wind. Contours indicate regions of cor-  in tropical Atlantic MJJ with SST ano-
                    relation greater than +0.5 (solid black   malies within the southeastern tropical
                    line) for TSM anomalies. The diagonal   Atlantic (ARROW; 10° S-20 °S, 10°W-5°E;
                    band in Figure 2a indicates the propa-  oceanic black box) in the NDJ. Only tho-
                    gation path of the SST anomalies from   se correlations that are significant at a
  -0.6       -0.4       -0.2        0.0       0.2       0.4       0.6      -0.6       -0.4       -0.2        0.0       0.2       0.4       0.6     east to west. Time-longitude diagrams   95% confidence level. The contours in
                    of SST anomalies composites standar-   (a) indicate regions of correlation grea-
                    dized for: (c) WET years, (d) DRY years,   ter than +0.5 for SSTA).


                   2.3. Extreme meteorological events in    518  injured  and  11  dead.  Losses  totaled
 c        SETA ND(-1)J(0) X (SST, SLP, WIND & Omega) MJJ(0)
                   the South-Southeast region of Brazil:    approximately US$350 million  and 14
                                                                                        1
                   the case of Cyclone Catarina             municipalities declared a state of public ca-
                                                            lamity (G1 on-line Santa Catarina; MCTAG-
                      Regarding extreme events in South     GART-COWAN et al., 2006; PEREIRA FILHO
                   America, despite the ocean-atmosphere    et al., 2010).
                   teleconnections and their consequences      From this perspective, it becomes evi-
                   described above with a focus on the Trop-  dent that the need to understand the varia-
                   ical Atlantic, the importance of extratropi-  tions in intensity and frequency of extreme
                   cal cyclones in the south/southeast region   events in a given region depends on how
                   of Brazil also deserves to be emphasized.   comprehensive the scientific knowledge is
                   For example, the passage of an extratrop-  about the environmental factors that con-
                   ical cyclone, which later gave rise to a   trol them. In this context, the modulating
 -1.0 -0.8  -0.6  -0.4  -0.2   0.0  0.2   0.4   0.6   0.8   1.0     subtropical cyclone in the same area, was   potential of the ocean has been increas-
                   related to the development of the first hur-  ingly explored. In the case of Catarina, the
                   ricane ever documented in the South At-  phenomenon that hit the coast of Santa
 Source: Hounsou-Gbo et al. (2019)  lantic: Catarina. It hit southern Brazil in late   Catarina on March 28, 2004 was charac-
                                                                             2
                   March 2004, leaving more than 27,500     terized as a cyclone , and not a hurricane,
                   homeless, nearly 36,000 homes damaged,   according to Cunha  et al. (2004) citing


 404  BLUE ECONOMY                                                          Ocean and Climate: New Challenges  405
 404