
Page 403 - Economia Azul - versão: inglês
P. 403
the teleconnection of the summer Atlantic lantic and descending/ascending branch in
Niño to the subsequent winter ENSO was the central equatorial Pacific. These distur- Figure 1b
weak, the winter Atlantic Niño influenced bances in the zonal atmospheric circulation
the ENSO almost a year in advance. The re- induce anomalies of east/west winds on b 25-year running correlation
sults of Hounsou-Gbo et al. (2020) also sug- the surface, the latter being favorable to
gest that both summer and winter Atlantic the development of ENSO (KEENLYSIDE et
Niño events interact with ENSO through al., 2013; LOSADA and RODRÍGUEZ-FON- 0.8
the same interbasin teleconnection mech- SECA, 2016). However, it is observed that 0.6
anism. Positive/negative SST anomalies in the ENSO delay over the winter Atlantic
the equatorial Atlantic affect the Walker Niño is clearly greater than the ENSO de- 0.4
circulation generating an anomalous as- lay over the summer Atlantic Niño that had 0.2
cending/descending branch over the At- previously been identified (Figure 1).
0.0
Figure 1a -0.2
ATL3 (JAS(0) x OND(0)
-0.4 NINO3 (OND(0) x FMA(1)
ATL3 (JAS(0) x NINO3 OND(0)
a Lead-lag correlation [OND(0) ATL3] & NINO3 -0.6 ATL3 (OND(0) x NINO3 OND(1)
OND(+1) -0.8 ATL3 (JAS(0) x OND(0)
NINO3 (OND(0) x FMA(1)
Nino3 leading II Nino3 lagging FMA(+1) Figure 1. a) Lead-lag correlation, 51-75 indicate Niño3 lagging behind the
ATL3 (JAS(0) x NINO3 OND(0)
ASO(+1)
ATL3 (OND(0) x NINO3 OND(1)
JJA(+1)
-1.0
21-45
31-55
26-50
06-30
11-35
01-25
16-40
36-60
76-00
71-95
66-90
91-15
86-10
81-05
56-80
41-65
46-70
61-85
AMJ(+1)
DJF (0)
Source: Hounsou-Gbo et al. (2020)
OND(0)
ASO(0)
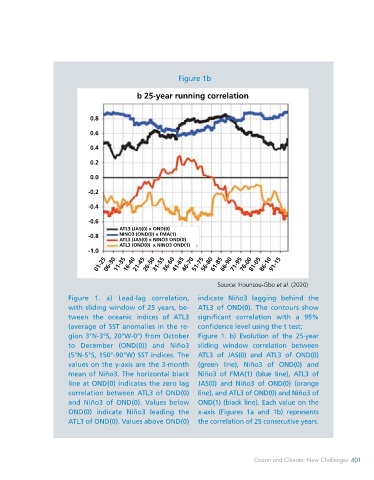
ATL3 of OND(0). The contours show
with sliding window of 25 years, be-
JJA(0)
tween the oceanic indices of ATL3
significant correlation with a 95%
AMJ(0)
confidence level using the t test;
(average of SST anomalies in the re-
FMA(0)
gion 3°N-3°S, 20°W-0°) from October
DJF(-1)
25-49
35-59
30-54
45-69
40-64
50-74
sliding window correlation between
10-34
05-29
20-44
15-39
00-24
55-79
80-04
75-99
90-14
85-09
70-94
60-84
to December (OND(0)) and Niño3
65-89
ATL3 of JAS(0) and ATL3 of OND(0)
(5°N-5°S, 150°-90°W) SST indices. The
(green line), Niño3 of OND(0) and
values on the y-axis are the 3-month Figure 1. b) Evolution of the 25-year
mean of Niño3. The horizontal black Niño3 of FMA(1) (blue line), ATL3 of
line at OND(0) indicates the zero lag JAS(0) and Niño3 of OND(0) (orange
-0.7 -0.6 -0.5 -0.4 -0.3 -0.2 -0.1 0.0 0.1 0.2 0.3 0.4 0.5 0.6 0.7
correlation between ATL3 of OND(0) line), and ATL3 of OND(0) and Niño3 of
and Niño3 of OND(0). Values below OND(1) (black line). Each value on the
OND(0) indicate Niño3 leading the x-axis (Figures 1a and 1b) represents
ATL3 of OND(0). Values above OND(0) the correlation of 25 consecutive years.
Source: Hounsou-Gbo et al. (2020)
400 BLUE ECONOMY Ocean and Climate: New Challenges 401