
Page 739 - Economia Azul - versão: inglês
P. 739
Other databases, known as online that are also easily accessible, such as the
data repositories, aim at Open Science, Global Fishing Watch.
50 0’0 W 45 0’0 W 40 0’0 W 35 0’0 W 30 0’0 W 25 0’0 W 20 0’0 W
o
o
o
o
o
o
o
o
o
o
o
o
o
o
which are open and free data for re- The possibilities of using these databases
searchers (LIN et al., 2020). There are should significantly contribute to the spatial
10 0’0’’N 10 0’0’’N many online repositories available today, analysis of the areas of operation of the na-
o
o
many of them are focused on specific tional fishing fleet, in time and space, tar-
areas, whether for biodiversity, ecology, geting the captures of Brazilian marine ex-
o
5 0’0’’N 5 0’0’’N oceanography, among other areas. There tractive fisheries, as well as updating infor-
o
is a quality control of this data for each mation on these important fishing resources
ASPSP
repository governed by licenses and us- for the fishing community of the artisanal
0 0’0’’ 0 0’0’’
o
o
age policies (LIN et al., 2020). The most and industrial fleet in Brazil, constituting a
famous in the area of biodiversity are the landmark in the analysis of the spatial dis-
Ocean Biodiversity Information System tribution of the fleets and contributing deci-
5 0’0’’S 5 0’0’’S
o
o
(OBIS) and the Global Biodiversity Infor- sively with subsidies for the spatial planning
mation Facility (GBIF), but there are others and ordering of these fisheries.
10 0’0’’S 10 0’0’’S
o
o
Atlantic 2. Tracking national fishing vessels
Ocean
o
15 0’0’’S 15 0’0’’S
o
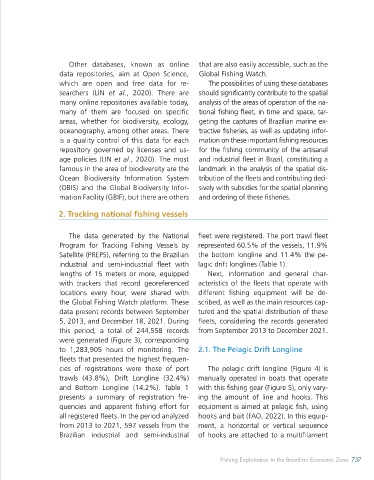
The data generated by the National fleet were registered. The port trawl fleet
Program for Tracking Fishing Vessels by represented 60.5% of the vessels, 11.9%
Trindade Satellite (PREPS), referring to the Brazilian the bottom longline and 11.4% the pe-
20 0’0’’N 20 0’0’’N
o
o
industrial and semi-industrial fleet with lagic drift longlines (Table 1).
lengths of 15 meters or more, equipped Next, information and general char-
25 0’0’’S 25 0’0’’S with trackers that record georeferenced acteristics of the fleets that operate with
o
o
locations every hour, were shared with different fishing equipment will be de-
the Global Fishing Watch platform. These scribed, as well as the main resources cap-
30 0’0’’N 30 0’0’’N
o
o
data present records between September tured and the spatial distribution of these
5, 2013, and December 18, 2021. During fleets, considering the records generated
this period, a total of 244,558 records from September 2013 to December 2021.
o
35 0’0’’S 35 0’0’’S
o
were generated (Figure 3), corresponding
Exclusive Economic Zone (EEZ)
Vessels to 1,283,905 hours of monitoring. The 2.1. The Pelagic Drift Longline
o
40 0’0’’S 40 0’0’’S fleets that presented the highest frequen-
o
o
o
o
o
o
o
50 0’0 W 45 0’0 W 40 0’0 W 35 0’0 W 30 0’0 W 25 0’0 W 20 0’0 W cies of registrations were those of port The pelagic drift longline (Figure 4) is
o
o
o
o
o
o
o
o
0 312.5 625 1.250 1.875 2.500 3.125 trawls (43.8%), Drift Longline (32.4%) manually operated in boats that operate
Kilometers and Bottom Longline (14.2%). Table 1 with this fishing gear (Figure 5), only vary-
Source: Authors based on Global Fishing Watch (2022) presents a summary of registration fre- ing the amount of line and hooks. This
quencies and apparent fishing effort for equipment is aimed at pelagic fish, using
Figure 3. Map of the Brazilian coast and itored vessels in the Brazilian industrial all registered fleets. In the period analyzed hooks and bait (FAO, 2022). In this equip-
EEZ and the Southwest Atlantic Ocean, fishing fleet, between September 2013 from 2013 to 2021, 597 vessels from the ment, a horizontal or vertical sequence
showing the spatial distribution of mon- and December 2021. Brazilian industrial and semi-industrial of hooks are attached to a multifilament
736 BLUE ECONOMY Fishing Exploitation in the Brazilian Economic Zone 737
736