
Page 735 - Economia Azul - versão: inglês
P. 735
As for national fisheries production, ac- captured resource was the croaker (Figure
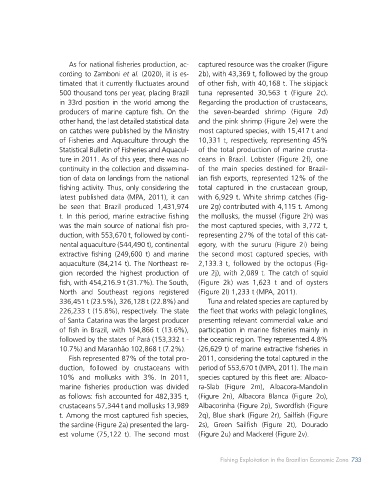
Figure 1. The coast and the Brazilian Exclusive Economic Zone
(EEZ), divided into four regions, including Trindade Island and cording to Zamboni et al. (2020), it is es- 2b), with 43,369 t, followed by the group
the São Pedro and São Paulo Archipelago (ASPSP). timated that it currently fluctuates around of other fish, with 40,168 t. The skipjack
500 thousand tons per year, placing Brazil tuna represented 30,563 t (Figure 2c).
50 0’0 W 45 0’0 W 40 0’0 W 35 0’0 W 30 0’0 W 25 0’0 W 20 0’0 W
o
o
o
o
o
o
o
o
o
o
o
o
o
o
in 33rd position in the world among the Regarding the production of crustaceans,
producers of marine capture fish. On the the seven-bearded shrimp (Figure 2d)
other hand, the last detailed statistical data and the pink shrimp (Figure 2e) were the
10 0’0’’N 10 0’0’’N
o
o o
10 0’0’’N
on catches were published by the Ministry most captured species, with 15,417 t and
of Fisheries and Aquaculture through the 10,331 t, respectively, representing 45%
5 0’0’’N 5 0’0’’N Statistical Bulletin of Fisheries and Aquacul- of the total production of marine crusta-
5 0’0’’N
o o
o
ture in 2011. As of this year, there was no ceans in Brazil. Lobster (Figure 2f), one
ASPSP continuity in the collection and dissemina- of the main species destined for Brazil-
0 0’0’’
0 0’0’’ North 0 0’0’’ tion of data on landings from the national ian fish exports, represented 12% of the
o
o o
fishing activity. Thus, only considering the total captured in the crustacean group,
Northeast latest published data (MPA, 2011), it can with 6,929 t. White shrimp catches (Fig-
5 0’0’’S
5 0’0’’S 5 0’0’’S be seen that Brazil produced 1,431,974 ure 2g) contributed with 4,115 t. Among
o o
o
t. In this period, marine extractive fishing the mollusks, the mussel (Figure 2h) was
was the main source of national fish pro- the most captured species, with 3,772 t,
10 0’0’’S
10 0’0’’S 10 0’0’’S duction, with 553,670 t, followed by conti- representing 27% of the total of this cat-
o
o o
Atlantic
Ocean nental aquaculture (544,490 t), continental egory, with the sururu (Figure 2i) being
extractive fishing (249,600 t) and marine the second most captured species, with
15 0’0’’S 15 0’0’’S
15 0’0’’S
o o
o
aquaculture (84,214 t). The Northeast re- 2,133.3 t, followed by the octopus (Fig-
gion recorded the highest production of ure 2j), with 2,089 t. The catch of squid
fish, with 454,216.9 t (31.7%). The South, (Figure 2k) was 1,623 t and of oysters
o
20 0’0’’N Trindade 20 0’0’’N
20 0’0’’N
o o
North and Southeast regions registered (Figure 2l) 1,233 t (MPA, 2011).
336,451 t (23.5%), 326,128 t (22.8%) and Tuna and related species are captured by
226,233 t (15.8%), respectively. The state the fleet that works with pelagic longlines,
o
o o
25 0’0’’S
25 0’0’’S Southeast 25 0’0’’S
of Santa Catarina was the largest producer presenting relevant commercial value and
of fish in Brazil, with 194,866 t (13.6%), participation in marine fisheries mainly in
o
o o
30 0’0’’N 30 0’0’’N followed by the states of Pará (153,332 t - the oceanic region. They represented 4.8%
30 0’0’’N
South 10.7%) and Maranhão 102,868 t (7.2%). (26,629 t) of marine extractive fisheries in
Fish represented 87% of the total pro- 2011, considering the total captured in the
35 0’0’’S
35 0’0’’S 35 0’0’’S duction, followed by crustaceans with period of 553,670 t (MPA, 2011). The main
o
o o
10% and mollusks with 3%. In 2011, species captured by this fleet are: Albaco-
Exclusive Economic Zone (EEZ)
marine fisheries production was divided ra-Slab (Figure 2m), Albacora-Mandolin
40 0’0’’S 40 0’0’’S as follows: fish accounted for 482,335 t, (Figure 2n), Albacora Blanca (Figure 2o),
40 0’0’’S
o
o o
50 0’0 W 45 0’0 W 40 0’0 W 35 0’0 W 30 0’0 W 25 0’0 W 20 0’0 W crustaceans 57,344 t and mollusks 13,989 Albacorinha (Figure 2p), Swordfish (Figure
o
o
o
o
o
o
o
o
o
o
o
o
o
o
0 310 620 1.240 1.860 2.480 3.100 t. Among the most captured fish species, 2q), Blue shark (Figure 2r), Sailfish (Figure
Kilometers the sardine (Figure 2a) presented the larg- 2s), Green Sailfish (Figure 2t), Dourado
Source: Authors based on Global Fishing Watch (2022) est volume (75,122 t). The second most (Figure 2u) and Mackerel (Figure 2v).
732 BLUE ECONOMY Fishing Exploitation in the Brazilian Economic Zone 733
732