
Page 61 - Economia Azul - versão: inglês
P. 61
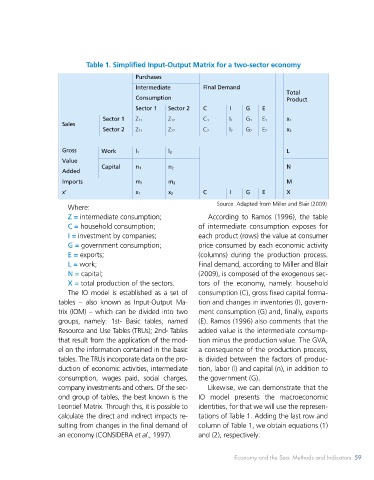
The chapter will be divided into 3 sec-  thesizing  the  main  studies  on  the  con-  Table 1. Simplified Input-Output Matrix for a two-sector economy
 tions, following this introduction. The  tribution of this “economic sector”, as
                                         Purchases
 second section presents and defines the  well as showing two advances in the ap-
                                         Intermediate        Final Demand
 methodologies  frequently  identified  in  plication of the Input-Output model and   Consumption   Total
 studies of the Sea/Coastal or Blue Econo-  System of National Accounts for oceanic   Product
 my. The third section is dedicated to syn-  accounts  Sector 1   Sector 2   C   I   G   E
                               Sector 1   Z 11     Z 12      C 1     I 1   G 1   E 1   x 1
 2. Insights into the methods used to measure the contribution and   Sales   Sector 2   Z 21   Z 22   C 2   I 2   G 2   E 2   x 2
 quantification of economic impacts


                   Gross       Work      l 1       l 2                                L
 Statistics aimed at evaluating the maritime   Therefore, the concise methodological ex-  Value
 and coastal economy are increasingly being   planation will begin in the first subsection.  Added   Capital   n 1   n 2   N
 developed by researchers and governments   Imports   m 1   m 2                       M
 who  have  already  recognized their  impor-  2.1 Input-Output Model (IO)  x’   x 1   x 2   C   I   G   E   X
 tance for the national economy. Since the   It  is  the name  given  to  the  analytical
 1980s, several studies have been carried out   framework developed by Wassily Leontief   Where:  Source: Adapted from Miller and Blair (2009)
 around the world in order to measure the   in the mid-1930s. His fundamental frame-  Z = intermediate consumption;  According to Ramos (1996), the table
 contribution  and economic  impact  of this   work proposal is to analyze the interdepen-  C = household consumption;  of intermediate consumption exposes for
 portion of the economy for regions, nations   dence of industries in an economy (MILLER;   I = investment by companies;  each product (rows) the value at consumer
 and even continents (CARVALHO, 2018).  BLAIR, 2009). That is, it indicates the activity   G = government consumption;  price consumed by each economic activity
 To better understand the evolution of this   of a group of industries that produce prod-  E = exports;  (columns)  during  the  production  process.
 theme over the years, it is essential to shed   ucts  (outputs)  and  consume  goods  from   L = work;  Final demand, according to Miller and Blair
 light on some methodologies used to achieve   other industries (inputs) in the production   N = capital;  (2009), is composed of the exogenous sec-
 the results. It is worth noting that some meth-  process, condensing the information in a   X = total production of the sectors.  tors of the economy, namely: household
 ods can measure the economy related – di-  table of inter-industry transactions (Table   The IO model is established as a set of   consumption (C), gross fixed capital forma-
 rectly and indirectly – to the sea and addition-  1). The IO model, through the Input-Output   tables  –  also  known  as  Input-Output  Ma-  tion and changes in inventories (I), govern-
 ally quantify the inherent social and economic   Matrix (IOM), is generally constructed from   trix (IOM) – which can be divided into two   ment consumption (G) and, finally, exports
 impacts. O’Donougue et al. (2021) mention   observed economic data for a specific geo-  groups, namely: 1st- Basic tables, named   (E). Ramos (1996) also comments that the
 that methodologies to assess impacts should   graphic region and annual measurement.  Resource and Use Tables (TRUs); 2nd- Tables   added value is the intermediate consump-
 focus on a myriad of economic, social, spa-  By displaying the links between sectors   that result from the application of the mod-  tion minus the production value. The GVA,
 tial and environmental dimensions, and the   and the economy – known as “intersec-  el on the information contained in the basic   a consequence of the production process,
 tendency is to adapt to consider as many   toral links”, “chains” or “back and forth   tables. The TRUs incorporate data on the pro-  is divided between the factors of produc-
 variables together as possible, forming more   links” –, it contributes to a better under-  duction of economic activities, intermediate   tion, labor (l) and capital (n), in addition to
 complex and complete models. In this sense,   standing of the economic structure, as well   consumption, wages paid, social charges,   the government (G).
 the authors point out that the input-output   as its transformation over the years, which,   company investments and others. Of the sec-  Likewise, we can demonstrate that the
 (IO) models are the most used, allowing the   therefore, is fundamental in the design of   ond group of tables, the best known is the   IO  model  presents  the  macroeconomic
 measurement of the total economy or a spe-  public policies (ZHAO et al., 2014). Also,   Leontief Matrix. Through this, it is possible to   identities, for that we will use the represen-
 cific sector, in addition to evaluating the im-  according to the author, IOM is widely used   calculate the direct and indirect impacts re-  tations of Table 1. Adding the last row and
 pacts on sectors, agents and economies and   in various economic disciplines and widely   sulting from changes in the final demand of   column of Table 1, we obtain equations (1)
 realizing the intra- and inter-industry flows.   used by researchers and policymakers.  an economy (CONSIDERA et al., 1997).  and (2), respectively:


 58   ECONOMIA AZUL                                                   Economy and the Sea: Methods and Indicators 59