
Page 418 - Economia Azul - versão: inglês
P. 418
the Recife Metropolitan Center combines areas in the city of Recife considering two The concern to protect public (sidewalks, In an attempt to value properties located
low topography, intense urbanization, different scenarios in 2100: (i) elevation of streets) and private (buildings, houses, ho- in potentially flooded areas, average values
population density and high ecology, tour- 0.5 m; and (ii) elevation of 1.0 m in rela- tels) heritage is notorious. However, simple per m² were obtained from the city hall of
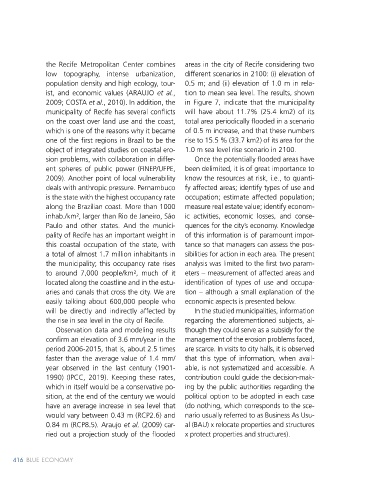
ist, and economic values (ARAUJO et al., tion to mean sea level. The results, shown questions, such as the average value per Recife in some streets and neighborhoods
2009; COSTA et al., 2010). In addition, the in Figure 7, indicate that the municipality square meter of properties in protected ar- (Table 1). The values were estimated based
municipality of Recife has several conflicts will have about 11.7% (25.4 km2) of its eas, tax collection in these areas, the contri- on the experience of technicians in the ITBI
on the coast over land use and the coast, total area periodically flooded in a scenario bution of these areas to the municipal econ- sector (Tax on the Transfer of Goods and
which is one of the reasons why it became of 0.5 m increase, and that these numbers omy or the municipality’s loss in revenue, are Real Estate), since an assessment is carried
one of the first regions in Brazil to be the rise to 15.5 % (33.7 km2) of its area for the not known. Neither is information known out to determine the amount of the tax to
object of integrated studies on coastal ero- 1.0 m sea level rise scenario in 2100. about the economic and social consequenc- be charged (between 1% and 2%). of the
sion problems, with collaboration in differ- Once the potentially flooded areas have es of the loss of areas by erosion/flood. value of real estate.
ent spheres of public power (FINEP/UFPE, been delimited, it is of great importance to
2009). Another point of local vulnerability know the resources at risk, i.e., to quanti- Figure 7. Flooded areas in the municipality of Recife for the 0.5 m
deals with anthropic pressure. Pernambuco fy affected areas; identify types of use and and 1.0 m sea level rise scenarios in 2100
is the state with the highest occupancy rate occupation; estimate affected population;
along the Brazilian coast. More than 1000 measure real estate value; identify econom- Inundation Areas
inhab./km², larger than Rio de Janeiro, São ic activities, economic losses, and conse- Recife - PE
Paulo and other states. And the munici- quences for the city’s economy. Knowledge
pality of Recife has an important weight in of this information is of paramount impor-
this coastal occupation of the state, with tance so that managers can assess the pos-
a total of almost 1.7 million inhabitants in sibilities for action in each area. The present
the municipality; this occupancy rate rises analysis was limited to the first two param-
to around 7,000 people/km², much of it eters – measurement of affected areas and
located along the coastline and in the estu- identification of types of use and occupa-
aries and canals that cross the city. We are tion – although a small explanation of the
easily talking about 600,000 people who economic aspects is presented below.
1:70.000
will be directly and indirectly affected by In the studied municipalities, information Meters
the rise in sea level in the city of Recife. regarding the aforementioned subjects, al- 0 501.000 2.000
Observation data and modeling results though they could serve as a subsidy for the Projection:UTM
Datum: SAD1969
confirm an elevation of 3.6 mm/year in the management of the erosion problems faced,
period 2006-2015, that is, about 2.5 times are scarce. In visits to city halls, it is observed
faster than the average value of 1.4 mm/ that this type of information, when avail-
year observed in the last century (1901- able, is not systematized and accessible. A
1990) (IPCC, 2019). Keeping these rates, contribution could guide the decision-mak-
which in itself would be a conservative po- ing by the public authorities regarding the Legend
0.5m SLR
sition, at the end of the century we would political option to be adopted in each case 1m SLR
have an average increase in sea level that (do nothing, which corresponds to the sce- City Boundary
Atlantic Ocean
would vary between 0.43 m (RCP2.6) and nario usually referred to as Business As Usu-
0.84 m (RCP8.5). Araujo et al. (2009) car- al (BAU) x relocate properties and structures
ried out a projection study of the flooded x protect properties and structures). Source: Costa et al. (2010)
416 BLUE ECONOMY Ocean and Climate: New Challenges 417