
Page 43 - Economia Azul - versão: inglês
P. 43
main results of the bibliometric research 2.1. Spatial and temporal distribution
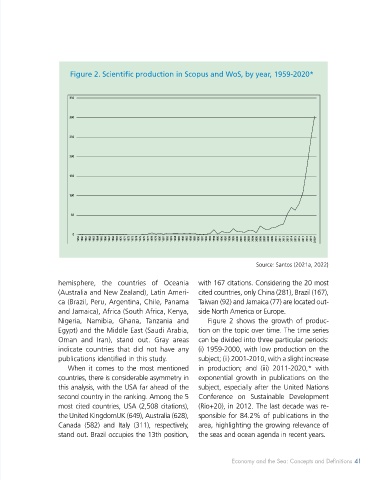
conducted in Santos (2021a, 2022) fol- Figure 2. Scientific production in Scopus and WoS, by year, 1959-2020*
3
lows. Only four documents are in Portu- The bibliometric search found a total
guese and were published as scientific arti- of 1,351 documents based on the search
350
cles (3) and an editorial (1). Although 36 of criteria. Although the themes are very
all documents considered (2.7% of the to- transversal to different economic activi-
300
tal) mention “Brazil” in their summary, only ties, Figure 1 shows that publications are
two (0.1% of the total and 5.6% of those concentrated in the northern hemisphere,
that mention Brazil) mention Amazônia particularly in North America (USA, Cana- 250
Azul (Blue Amazon), which is why which it da and Mexico), Europe (UK, Italy, Spain,
is not possible to provide a detailed analysis Germany, Greece, Norway and Portugal), 200
of the case of Brazil in this chapter based and Asia (China, India, Russia, Pakistan,
on the bibliometric research. Japan and Thailand). From the southern 150
4
100
Figure 1. Geographical distribution of scientific production, 50
by country, 1959-2020.*
0
1959 1960 1961 1962 1963 1964 1965 1966 1967 1968 1969 1970 1971 1972 1973 1974 1975 1976 1977 1978 1979 1980 1981 1982 1983 1984 1985 1986 1987 1988 1989 1990 1991 1992 1993 1994 1995 1996 1997 1998 1999 2000 2001 2002 2003 2004 2005 2006 2007 2008 2009 2010 2011 2012 2013 2014 2015 2016 2017 2018 2019 2020*
Source: Santos (2021a, 2022}
hemisphere, the countries of Oceania with 167 citations. Considering the 20 most
(Australia and New Zealand), Latin Ameri- cited countries, only China (281), Brazil (167),
ca (Brazil, Peru, Argentina, Chile, Panama Taiwan (92) and Jamaica (77) are located out-
and Jamaica), Africa (South Africa, Kenya, side North America or Europe.
Nigeria, Namibia, Ghana, Tanzania and Figure 2 shows the growth of produc-
Egypt) and the Middle East (Saudi Arabia, tion on the topic over time. The time series
Oman and Iran), stand out. Gray areas can be divided into three particular periods:
indicate countries that did not have any (i) 1959-2000, with low production on the
publications identified in this study. subject; (ii) 2001-2010, with a slight increase
When it comes to the most mentioned in production; and (iii) 2011-2020,* with
countries, there is considerable asymmetry in exponential growth in publications on the
this analysis, with the USA far ahead of the subject, especially after the United Nations
second country in the ranking. Among the 5 Conference on Sustainable Development
most cited countries, USA (2,508 citations), (Rio+20), in 2012. The last decade was re-
the United KingdomUK (649), Australia (628), sponsible for 84.2% of publications in the
Canada (582) and Italy (311), respectively, area, highlighting the growing relevance of
Source: Santos (2021a, 2022) stand out. Brazil occupies the 13th position, the seas and ocean agenda in recent years.
40 BLUE ECONOMY Economy and the Sea: Concepts and Definitions 41
40 BLUE ECONOMY