
Page 442 - Economia Azul - versão: inglês
P. 442
systems (OSSEs - Observing System Simula- For example, from 2023 onwards, altime- 0 . .. ... .. ... . .. . ............
tion Experiments). OSEs are sensitivity exper- try data from the Surface Water and Ocean 100 0,2
iments of analysis to observations that seek Topography (SWOT) satellite will provide Depth (m) 200 0 (m.s -1)
300
to identify the relative importance of obser- new information about the submeso and 400 XBT -0,2
vational systems, or observed quantities, in mesoscale circulation in the global ocean. 0 0,2
100
analysis and predictability (OKE et al., 2015; Today there is a great effort underway in Depth (m) 200 0 (m.s -1)
FUJI et al., 2019; TANAJURA et al., 2020). the main centers of operational ocean- 300 FREE -0,2
400
For example, in Dorfschäfer et al. ography to carry out OSSEs and prepare 0 0,2
(2020), an OSE was performed to identify the assimilation and forecasting systems Depth (m) 100 0 (m.s -1)
200
the importance of temperature data from to receive this data (BONADUCE et al., 300 RODAS -0,2
XBTs in the HYCOM+RODAS system. In one 2018; FUJII et al., 2019). The challenges 400
0
integration, SST, SSHA and T/S profiles from are great, as the number of altimetric data Depth (m) 100 0,2 (m.s -1)
0
200
Argo were assimilated and, in another in- to be assimilated will increase by two or- 300 RODAS XBT - BKG -0,2
tegration, data from XBTs were included, ders of magnitude and the associated er- 400
0
such as the NOAA AX-97 line between rors will be correlated in time and space. 100 0,2
0
Vitória and Trindade Island, maintained in However, the benefits they will bring are Depth (m) 200 RODAS XBT - ANL -0,2 (m.s -1)
300
NOAA’s partnership with MCTI in the con- of enormous value, both for science and 400 - 40 -39 -38 -37 -36 -35 -34 -33 -32 -31
text of the MOVAR project. Only when the for a chain of services in the Blue Economy Longitude
XBTs data were assimilated an accurate that thrive on scientific advances. Source: Adapted from Dorfschäfer et al. (2020)
representation of the meanderings of the The operational oceanography value
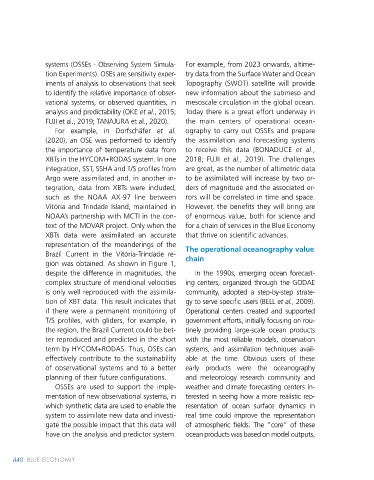
Figure 1. Vertical section of me-
Brazil Current in the Vitória-Trindade re- chain ridional velocity (m/s) along the line tion. Third line: HYCOM+RODAS with
gion was obtained. As shown in Figure 1, of AX-97 XBTs (sensors position rep- assimilation of SST, SSH and Argo T/S
profiles. Fourth line: HYCOM+RODAS
despite the difference in magnitudes, the In the 1990s, emerging ocean forecast- resented by black dots) on February immediately before data assimilation
complex structure of meridional velocities ing centers, organized through the GODAE 27, 2012. First line: speeds estimated from XBTs; Fifth line: HYCOM+RODAS
is only well reproduced with the assimila- community, adopted a step-by-step strate- geostrophically from the data. Sec- immediately after data assimilation
tion of XBT data. This result indicates that gy to serve specific users (BELL et al., 2009). ond line: HYCOM without assimila- from XBTs.XBTs.
if there were a permanent monitoring of Operational centers created and supported
T/S profiles, with gliders, for example, in government efforts, initially focusing on rou-
the region, the Brazil Current could be bet- tinely providing large-scale ocean products i.e., basic ocean variables in the native grids of This development mechanism has been
ter reproduced and predicted in the short with the most reliable models, observation the models, which were easy to manipulate successfully supported in Europe through
term by HYCOM+RODAS. Thus, OSEs can systems, and assimilation techniques avail- by non-expert modeling users (BAHUREL et the GMES program with the MERSEA and
effectively contribute to the sustainability able at the time. Obvious users of these al., 2009). This later led to more established MyOcean projects (e.g., JOHANNESSEN et
of observational systems and to a better early products were the oceanography models and products dedicated to a group al., 2006; BAHUREL et al., 2009). This strat-
planning of their future configurations. and meteorology research community and of “middle users” who could better define a egy still prevails today around the world:
OSSEs are used to support the imple- weather and climate forecasting centers in- wide range of applications and end users and only government initiatives with public re-
mentation of new observational systems, in terested in seeing how a more realistic rep- whether a given application was econom- sources over decades can sustain the nec-
which synthetic data are used to enable the resentation of ocean surface dynamics in ically reliable. In this way, end users paved essary developments of satellites and in
system to assimilate new data and investi- real time could improve the representation the way for “intermediate users” to trans- situ observational systems capable of pro-
gate the possible impact that this data will of atmospheric fields. The “core” of these form basic products into useful products viding observations describing the physical,
have on the analysis and predictor system. ocean products was based on model outputs, and services for the Blue Economy market. biogeochemical and ecosystem variability of
441
440 BLUE ECONOMIY From Observation to Data Use 441
From Observation to Data Use