
Page 768 - Economia Azul - versão: inglês
P. 768
areas, natural parks, areas listed as natural domestic product (GDP), the largest share The second pattern suggests a preference, the interior of the country. Tax collection
heritage, small villages, and coastal metro- in relation to the general total of Brazil is by both international and national tourists, from accommodation services is also rela-
politan areas. The list of BTRs and their lo- found in non-blue tourism areas. On the for blue tourism areas. Both indicators are tively higher in the BTRs, which is in line
cations is included in Appendix A. other hand, BTRs have average population much higher in these areas when compa- with other information that points to grea-
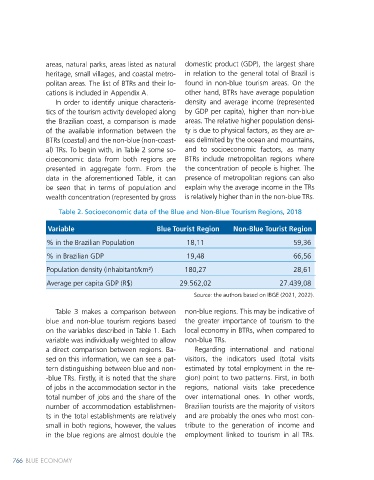
In order to identify unique characteris- density and average income (represented red to the indicators of the TRs located in ter tourism activity in the BTRs.
tics of the tourism activity developed along by GDP per capita), higher than non-blue Table 3. Data related to tourism in the Blue
the Brazilian coast, a comparison is made areas. The relative higher population densi- and Non-Blue Tourist Regions
of the available information between the ty is due to physical factors, as they are ar-
BTRs (coastal) and the non-blue (non-coast- eas delimited by the ocean and mountains, Variable Blue Tourist Region Non-Blue Tourist Region
al) TRs. To begin with, in Table 2 some so- and to socioeconomic factors, as many
cioeconomic data from both regions are BTRs include metropolitan regions where Share (%) of housing jobs in total jobs 1.08 0.47
presented in aggregate form. From the the concentration of people is higher. The Share (%) of accommodation establishments
data in the aforementioned Table, it can presence of metropolitan regions can also in total establishments 1.02 0.51
be seen that in terms of population and explain why the average income in the TRs
wealth concentration (represented by gross is relatively higher than in the non-blue TRs. Ratio between international visits and total
employment (Number of visitors/total jobs) 0.63 0.13
Table 2. Socioeconomic data of the Blue and Non-Blue Tourism Regions, 2018
Ratio between rnational visits and total
Variable Blue Tourist Region Non-Blue Tourist Region employment (Number of visitors/total jobs) 6.77 3.46
% in the Brazilian Population 18,11 59,36 Total employment collection (R$/total jobs) 148.74 61.77
% in Brazilian GDP 19,48 66,56 Source: the authors based on Ministry of Tourism (2021) and Ministry of Labor and Social Security (2022)
Population density (inhabitant/km²) 180,27 28,61
Finally, to analyze the specialization of largest barrier reef in the world. This sug-
Average per capita GDP (R$) 29.562,02 27.439,08 tourist activity in Brazilian TRs, the was gests that the preservation of ecosystems
Source: the authors based on IBGE (2021, 2022). calculated for each one of them. Figure 2 and other natural resources in these re-
shows the LQ of the BTRs (the values can gions is of fundamental importance for
t
Table 3 makes a comparison between non-blue regions. This may be indicative of be checked in Appendix A). The BTRs with the development of tourism activities, as
blue and non-blue tourism regions based the greater importance of tourism to the the two largest , LQ , that is, regions more they are highly valued by visitors. On the
t
on the variables described in Table 1. Each local economy in BTRs, when compared to specialized in tourism, are located in states other hand, the lowest values (values less
variable was individually weighted to allow non-blue TRs. in the northeast regions: Costa do Desco- than 1), that is, regions not specialized in
a direct comparison between regions. Ba- Regarding international and national brimento (BA) and Costa dos Corais (AL). tourism, are from the Tourist Region of
sed on this information, we can see a pat- visitors, the indicators used (total visits Costa do Descobrimento is an area listed Marajó Forests (PA) and Polo Lagos and
tern distinguishing between blue and non- estimated by total employment in the re- by UNESCO as a World Natural Heritage Campos Floridos (MA), regions that offer
-blue TRs. Firstly, it is noted that the share gion) point to two patterns. First, in both Site and offers several natural attractions several activities linked to ecotourism.
of jobs in the accommodation sector in the regions, national visits take precedence such as beaches, bays, coral reefs, man- These pieces of evidence allow us to
total number of jobs and the share of the over international ones. In other words, groves, navigable rivers, in addition to of- assume that the best-known beach des-
number of accommodation establishmen- Brazilian tourists are the majority of visitors fering conditions for the practice of adven- tinations that traditionally receive many
3
ts in the total establishments are relatively and are probably the ones who most con- ture tourism and econotourism . The Coral tourists, such as destinations in the North-
small in both regions, however, the values tribute to the generation of income and Coast is an environmental protection area east region, are the ones with the highest
in the blue regions are almost double the employment linked to tourism in all TRs. with 135 km of extension, it is the second degree of specialization in tourism-related
766 BLUE ECONOMY Blue Tourism in Brazil 767